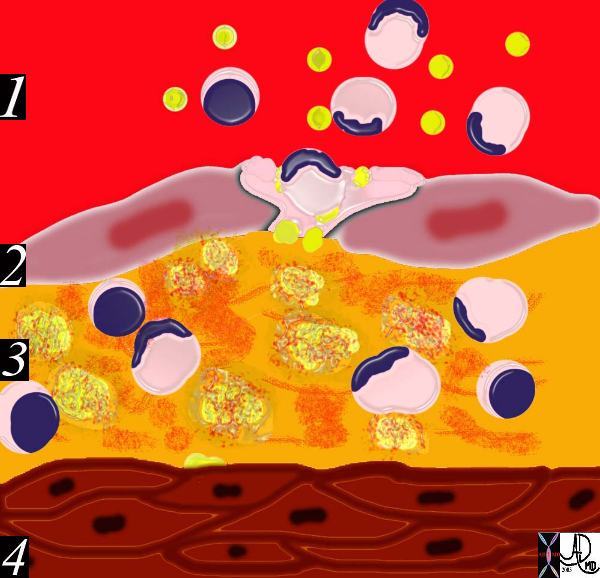
Circulating Lipoproteins
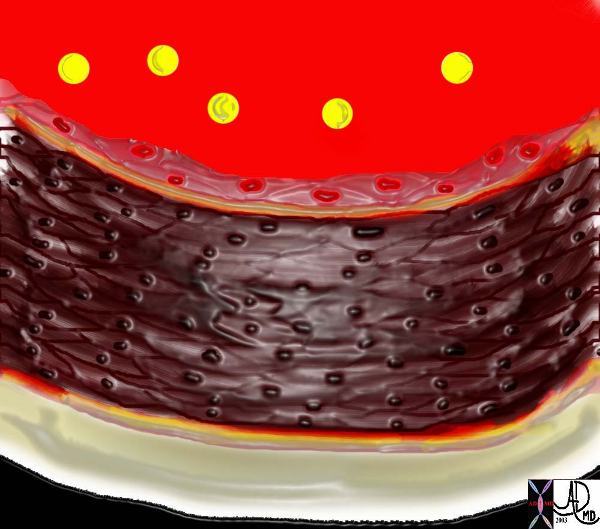
This image shows the lumen (red) single layer of the inner lining called the endothelium (pink) the muscular wall of a medium sized artery (maroon) and the yellow outer lining called the adventitia. There are lipoprotein molecules normally in the lumen. (yellow)The next step in atherogenesis is the accumulation of these lipoprotein molecules in the intima. Courtesy Ashley Davidoff MD. 33789 code heart artery wall histology normal drawing pathogenesis atherosclerosis atheroma
1) Breach of the endothelium
2) Migration of lipoproteins from the lumen into the intima where there are linear strands of proteoglycan.
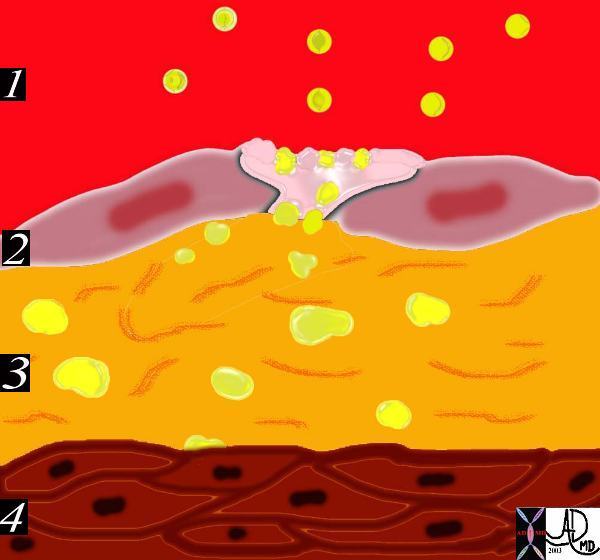
Atherosclerosis – 1) breach of the endothelium (33792d) artery, arteries
3) Formation of a lipoprotein-proteoglycan complex that traps the lipoprotein in the intima
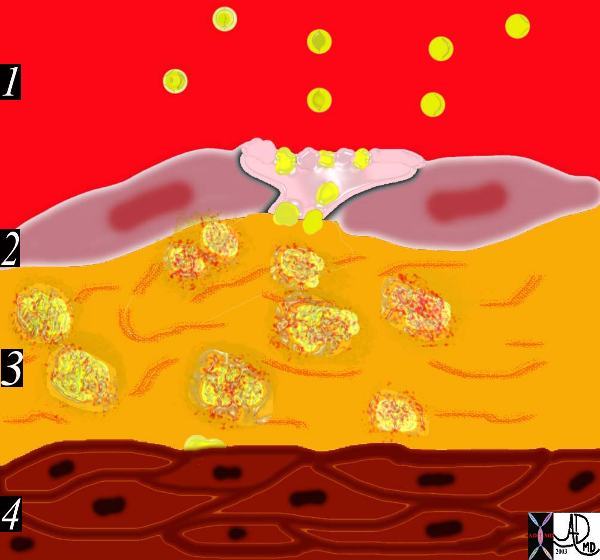
Inflammatory response
4) Migration of monocytes and lymphocytes from the lumen into the intima.
5) Transformation of the monocytes into macrophages and phagocytosis of the fat complexes to form fat laden foamy macrophages.
6) Migration of smooth muscle cells from the media into the intima and transformation into fibrocytes. A fibrous capsule around the fatty complex is formed.
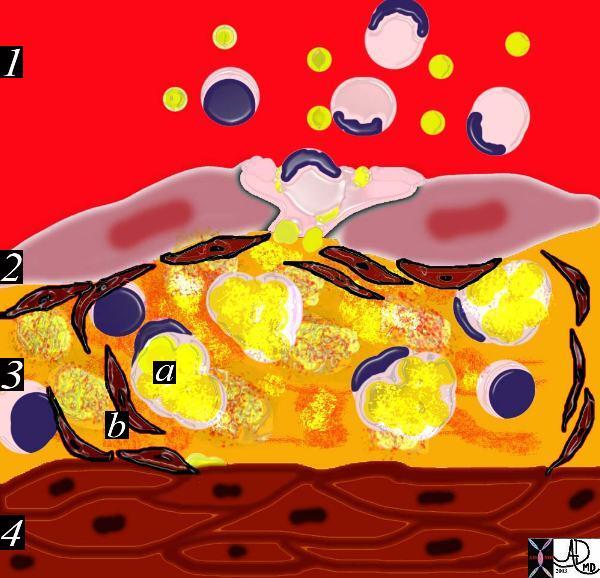
A fibrous capsule around the fatty complex is formed.
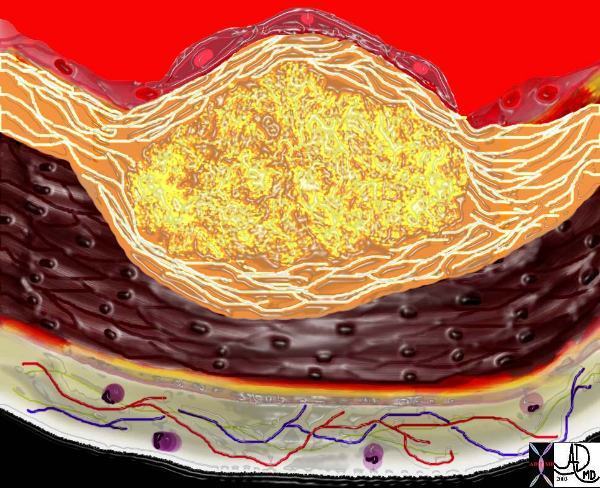
7) Cell death and destruction with associated formation of dystrophic calcification.
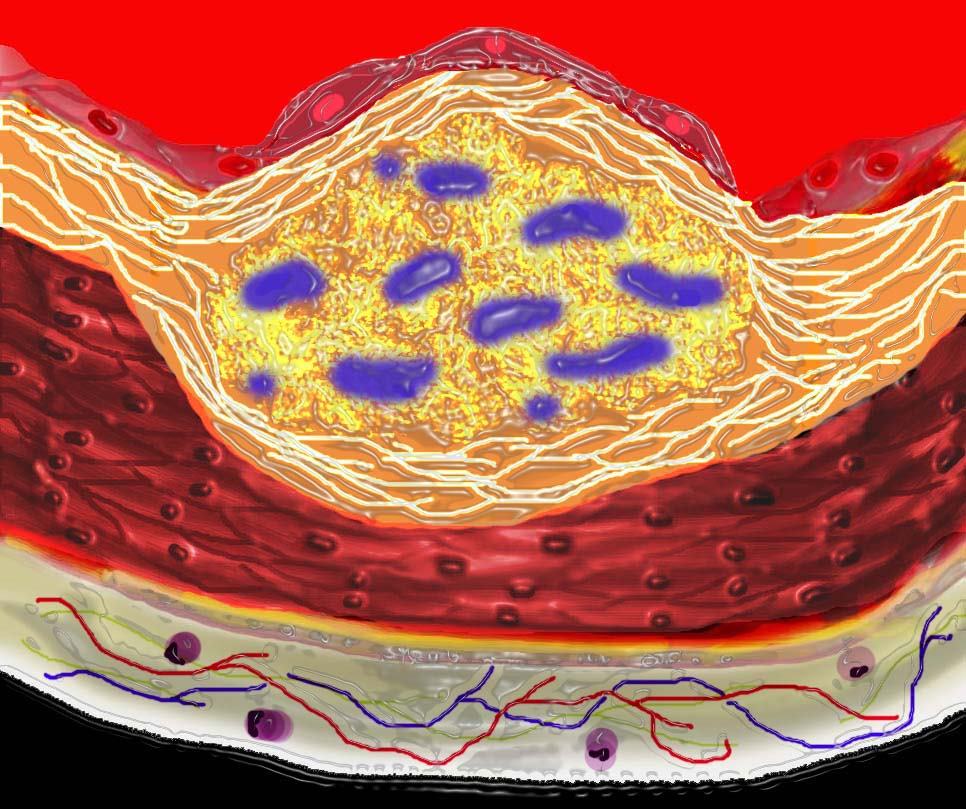
8) Growth of the atheromatous complex with impingement on the lumen.
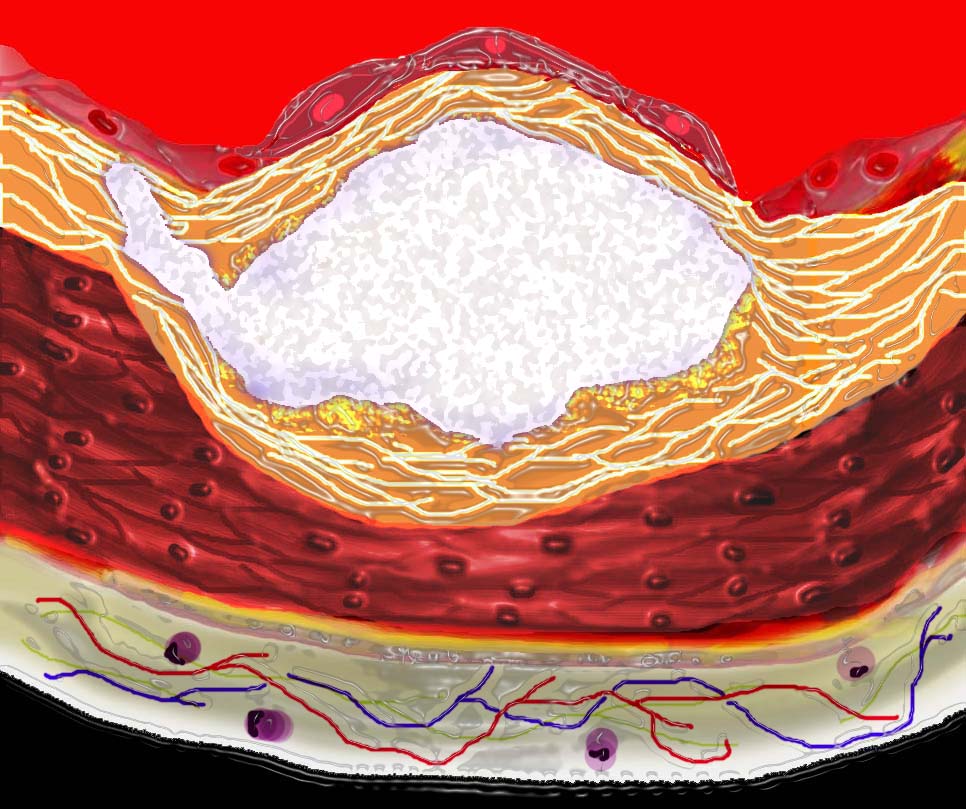
Progressive dystrophic calcification results in increase in the volume of the plaque. It may grow toward the external surfaceof the artery, in which case it has no hemodynamic significance or toward the lumen in which case it progressively impinges on the lumen
Ashley Davidoff
thecommonvein.net
Acute rupture of a plaque predisposes to superadded thrombosis and occlusion of the lumen.

This diagram shows denudation of the endothelial layer with exposure and rupture of the contents of the atherosclerotic plaque in volcanic fashion into the lumen. This event is catastrophic and can result in acute thrombosis and may even be a fatal event. 33801d Courtesy Ashley Davidoff MD. code heart artery atherosclerosis atheroma vulnerable plaque drawing Davidoff art
Ashley Davidoff
thecommonvein.net
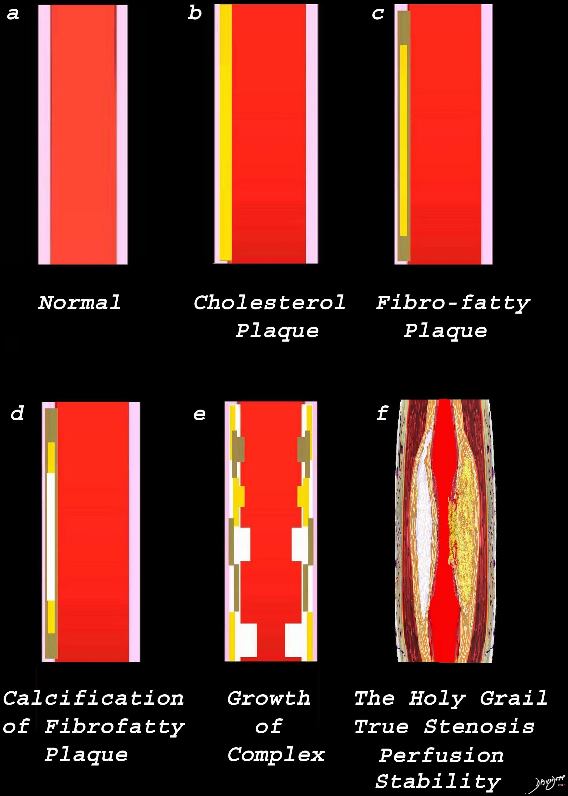
Image a is a normal artery – The wall is overlaid in pink. Image b reflects the early atherosclerotic process with cholesterol infiltration creating the cholesterol plaque (yellow). Image c shows the yellow plaque with beige fibrotic infiltrate resulting in the fibro-fatty plaque. Image d is a later form of the process where dystrophic calcification starts to be laid down (white overlay. In image e, the individual processes grow resulting in mass effect on the lumen, either as a fatty plaque (yellow) fibrotic plaque (beige) calcific plaque (white) or a mixed process. Image f reflects the holy grail of CT imaging. – accurate luminal evaluation, perfusion, and characterization of the plaque to determine stability, or lability.
Ashley Davidoff MD thecommonvein.net
Results From the ROMICAT II Trial
Circulation Cardiovascular Imaging Vol 11 No.8 Coronary Computed Tomography Angiography 2018
Results From the ROMICAT II Trial
Circulation Cardiovascular Imaging Vol 11 No.8 Coronary Computed Tomography Angiography 2018

Abdelrahman K et al Coronary Computed Tomography Angiography From Clinical Uses to Emerging Technologies: JACC State-of-the-Art Review
Volume 76, Issue 10, 8 September 2020, Pages 1226-1243

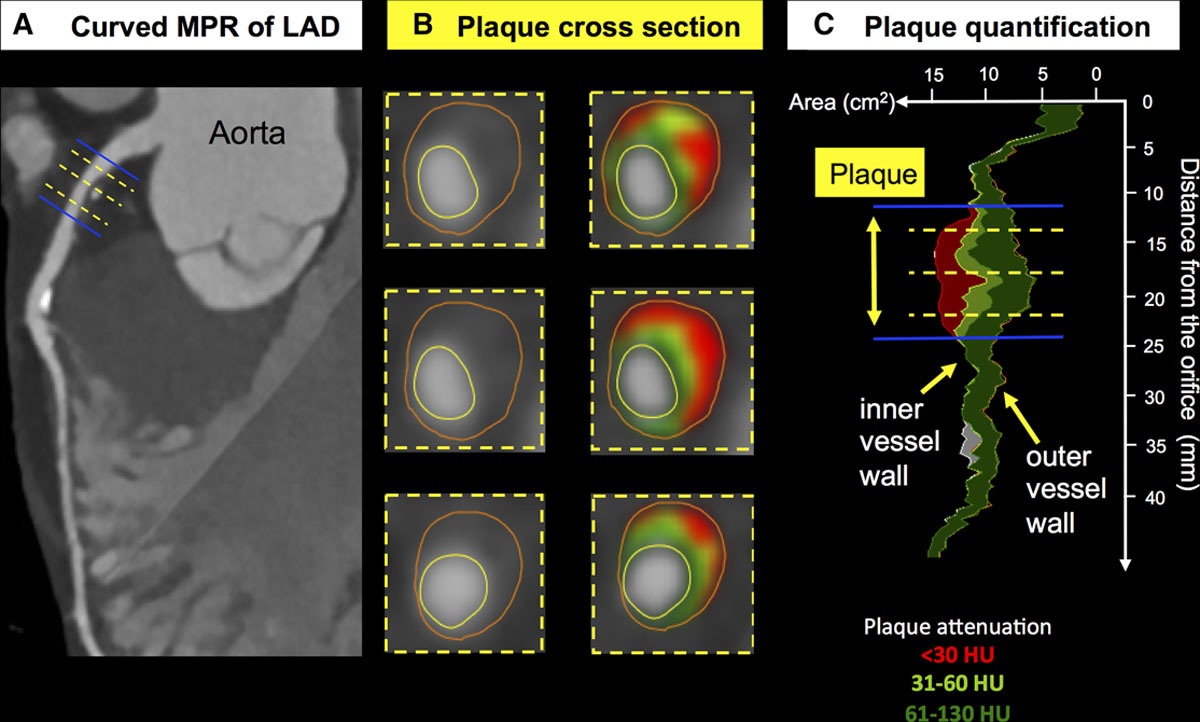
The CYT scan of the abdominal aorta shows severe atherosclerosis. The volume of disease enables measurement of density showing calcified plaque (300 HU) cholesterol plaque (-20HU) and mixed cholesterol and fibrous plaque (20HU)
thecommonvein.net
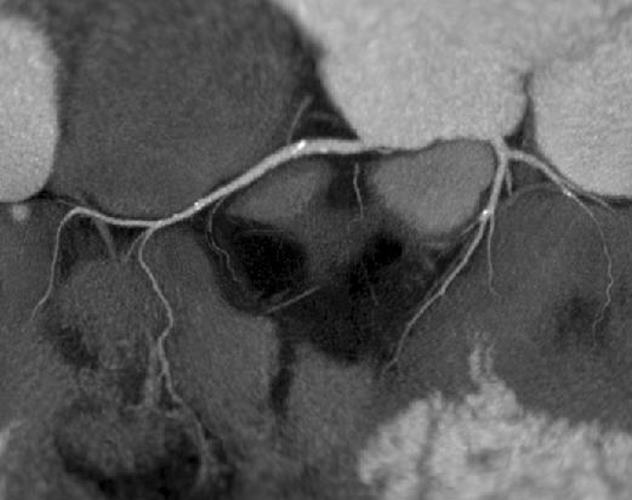
Reconstruction of the coronary CTA shows a calcified non stenotic plaque n proximal LAD, Circumflex and RCA
Courtesy Philips Medical Systems
44157
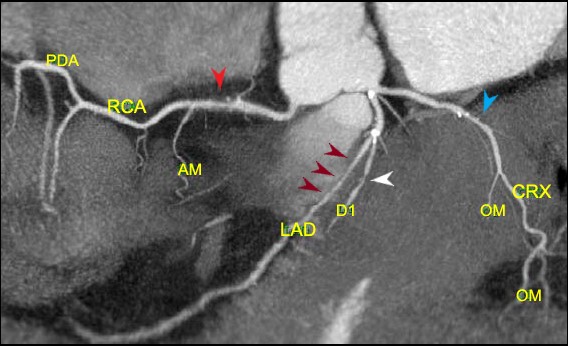
Reconstruction of the coronary arteries shows predominantly non calcified plaque resulting in an elongated stenosis of the proximal LAD (maroon arrows) and short segment stenoses of the proximal RCA (red arrow) circumflex (blue arrow) and diagonal (white arrow) Scattered calcifications are lees prominent in the RCA and circumflex lesions
Ashley Davidoff thecommonvein.net
44047b
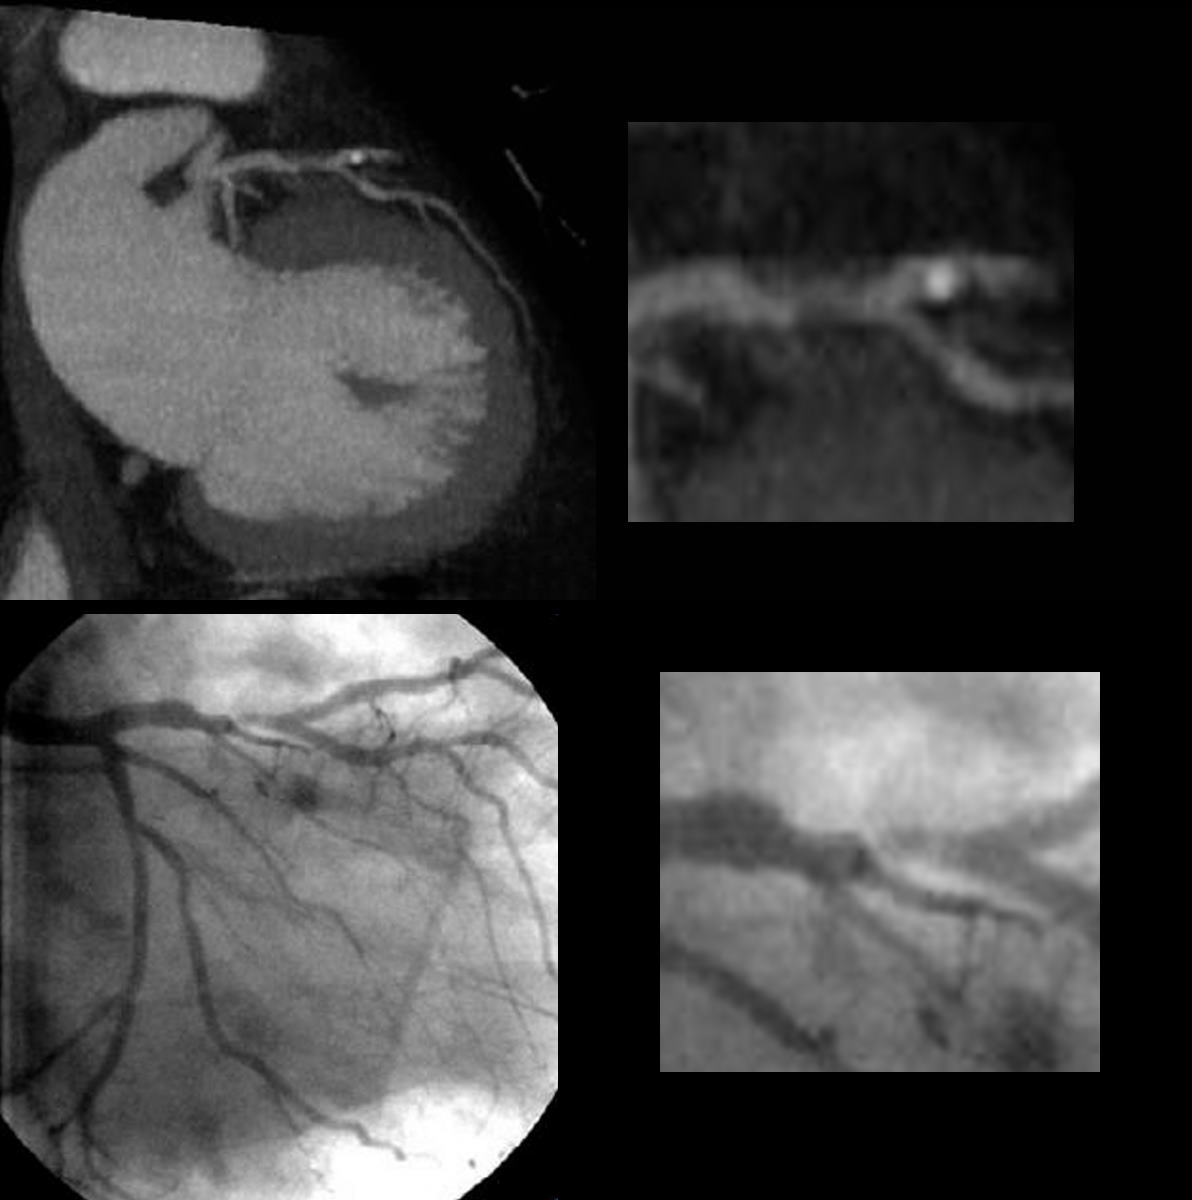
Reconstruction of the coronary CTA (above) shows a predominantly non calcified plaquein the proximal LAD resulting in an elongated stenosis. Scattered calcifications are lees prominent in the RCA and circumflex lesions
The coronary angiogram below confirms the stenoses
Courtesy Philips Medical Systems
44137c
CTA-Based Plaque Evaluation: A Substitute for Intravascular Imaging
Atheroma volume
- software makes it possible to
- quantify total plaque volume and
- assess the burden of different plaque types
- including calcific, noncalcific, and
- low-attenuation plaque (LAP) ( Figure 6 ).
- excellent correlation for
- total plaque volume quantification between
- IVUS and
- 256-slice CTA. In the
- total plaque volume quantification between
- PARADIGM (Progression of Atherosclerotic Plaque Determined By Computed Tomographic Angiography Imaging) study,
- plaque assessment by CTA
- statins promoted the conversion of unstable plaques to
- stabilized calcified plaques,
- decreased the progression of noncalcified plaques, and reduced total plaque burden
- plaque assessment by CTA
- excellent correlation for
- In the assessment of plaque distribution,
- varied across the epicardial coronary arteries,
- significantly lower plaque volume,
- or low-density plaque, in the left circumflex compared with the
- LAD and RCA
- or low-density plaque, in the left circumflex compared with the
- significantly lower plaque volume,
- varied across the epicardial coronary arteries,
- Predictive value,
- baseline total atheroma volume on nonobstructive lesions
- progressing to obstructive lesions
- was significant.
- plaque volume,
- particularly noncalcified plaque volume,
- stronger predictor of cardiovascular events
- compared with lumen stenosis and
- clinical risk profile in the
- particularly noncalcified plaque volume,
- CAPIRE (Coronary Atherosclerosis in Outlier Subjects: Protective and Individual Risk Factor Evaluation) study ( 79 SCOT-HEART trial, t
- Burden of low-attenuation coronary plaque was the
- strongest predictor of future MI
- outperforming
- cardiovascular risk scores,
- luminal stenosis severity
- coronary calcium scores, and
- total plaque volume ( 80 ).
- Burden of low-attenuation coronary plaque was the
- baseline total atheroma volume on nonobstructive lesions
-
Links and References
- Abdelraman et al JACC 2020
- Conte E., Mushtaq S., Pontone G., et. al.: Plaque quantification by coronary computed tomography angiography using intravascular ultrasound as a reference standard: a comparison between standard and last generation computed tomography scanners. Eur Heart J Cardiovasc Imaging 2020; 21: pp. 191-201.
-
TCV