
Contrast Differences
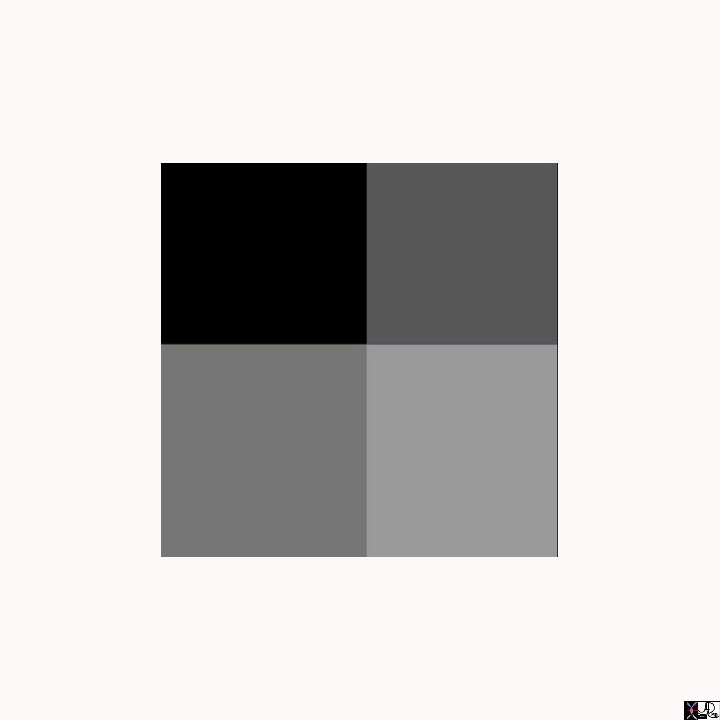
- The Hounsfield Units (HU) make up the grayscale in medical CT imaging.
- 4096 values levels of gray (12 bit) and
- ranges from
- -1024 HU to 3071 HU
- -1024 HU is black as in air
- 0 HU represents water (
- 3071 HU is white
- represents the densest tissue in a human body,
- tooth enamel. All other tissues are somewhere within this scale; fat is around -100 HU, muscle around 100 HU and bone spans from 200 HU (trabecular/spongeous bone) to about 2000 HU (cortical bone).
- ranges from
- 4096 values levels of gray (12 bit) and
-
- For practical purposes in the body
- approximate Hounsfield units from black to white
- density of air -1000HU As Black as Black can Be
- density of lung- -700 to -800
- fat -5 to -100
- density of fluid +5 to +15
- density of soft tissue +50
- density of calcium +50 to +500
- iodinated contrast + 100 to +500
“Contrast Resolution”
“Contrast Resolution”
The reason we see things is because of their difference in density the greater the difference the easier to see
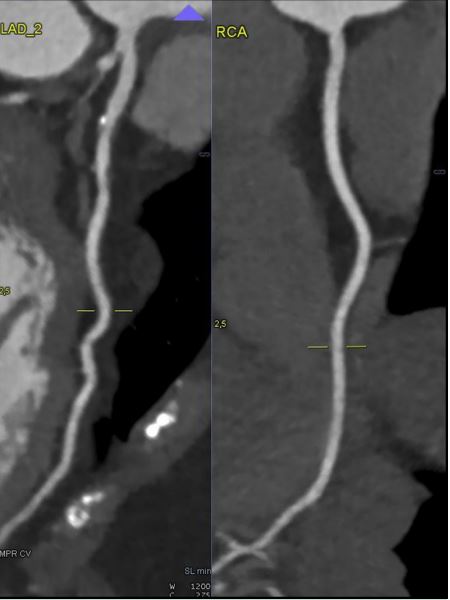
Punctate calcium noted in his LAD
Ashley Davidoff thecommonvein.net
Fjellhaugen K et al Increased Prevalence of Coronary Artery Disease in Severe Psoriasis and Severe Atopic Dermatitis The American Journal of Medicine (2015) 128, 1325-1334
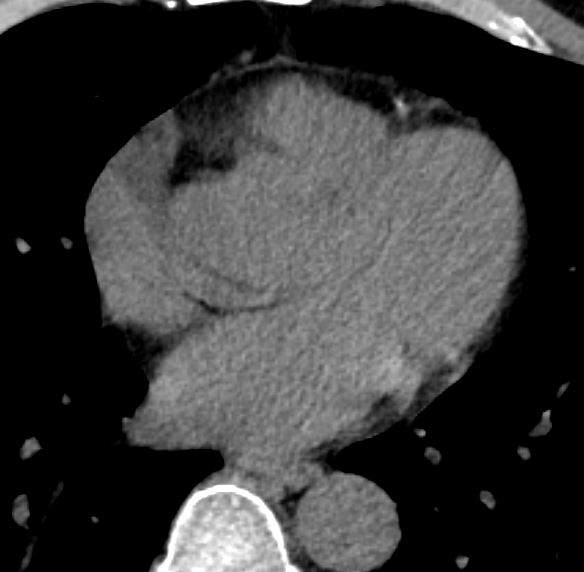
Delta of soft tissue of myocardium vs soft tissue blood = 0
When densities are distinctly different ie delta HU is great – they are easily visualized air -1000HU and bile about -10 so delta is -990 HU

gallbladder air methane nitrogen gas cholesterol stone isodense with bile fat subtle change CTscan 70269c02 b
Delta for air pocket in relation to the soft tissue = 1050HU
Delta of calcium in annulus vs soft tissue of heart = 450HU
Delta of fat of breast and soft tissues of glandular tissue 150HU
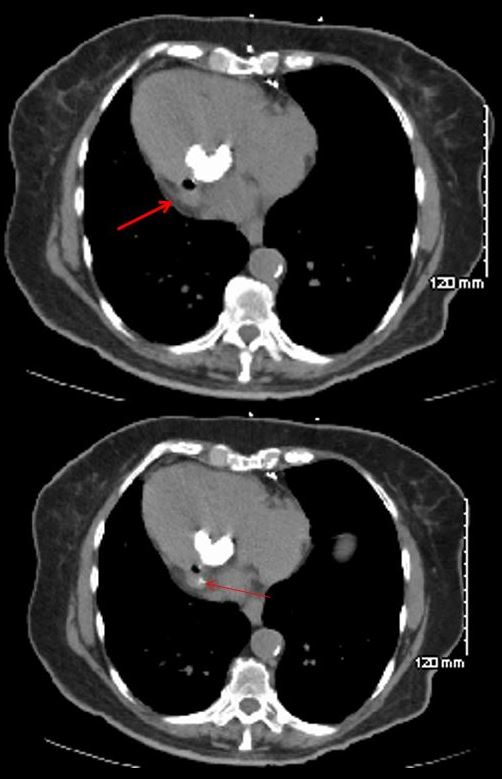
78 year old female with dextrocardia, presents 2 weeks after laparoscopic surgery with a fever. Prior CT showed dextrocardia with MAC. Repeat CT at the time of the fever, shows an air fluid on the lateral aspect of the MAC with disrupted calcification. Blood cultures were positive and a diagnosis of anaerobic gas forming endocarditis was made. She subsequently required MVR
Ashley Davidoff MD
thecommonvein.net
Why are these densities relevant to CTA of the coronaries?
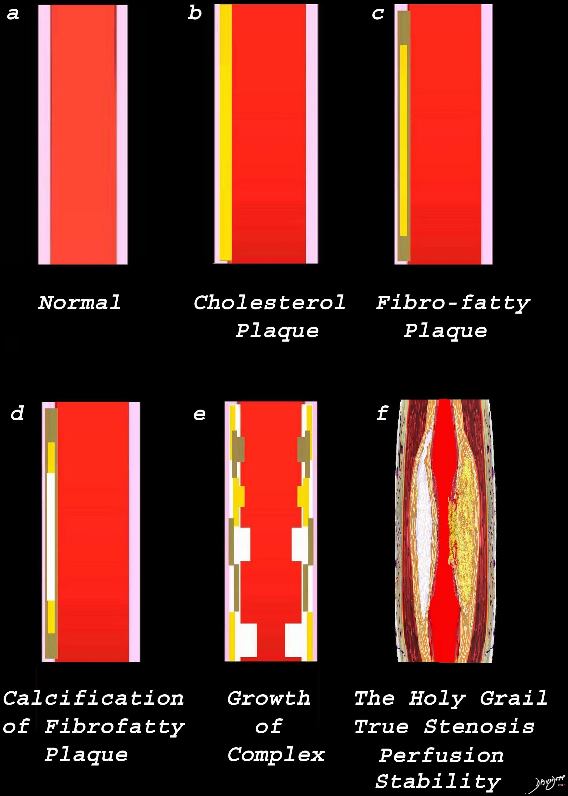
Image a is a normal artery – The wall is overlaid in pink. Image b reflects the early atherosclerotic process with cholesterol infiltration creating the cholesterol plaque (yellow). Image c shows the yellow plaque with beige fibrotic infiltrate resulting in the fibro-fatty plaque. Image d is a later form of the process where dystrophic calcification starts to be laid down (white overlay. In image e, the individual processes grow resulting in mass effect on the lumen, either as a fatty plaque (yellow) fibrotic plaque (beige) calcific plaque (white) or a mixed process. Image f reflects the holy grail of CT imaging. – accurate luminal evaluation, perfusion, and characterization of the plaque to determine stability, or lability.
Ashley Davidoff MD thecommonvein.net