- LV
- RV
- Atria
- Pericardium
- Findings
- Linear
- Nodular
- Focal
- Diffuse
- Normal Variants
- Diseases
- Ischemic Heart Disease
- Non Ischemic
- Myocarditis
- Congestive Cardiomyopathy
- Sarcoidosis
- Amyloidosis
- Hypertrophic Cardiomyopathy
- Chloroquine Cardiomyopathy
- SLE
- Scleroderma
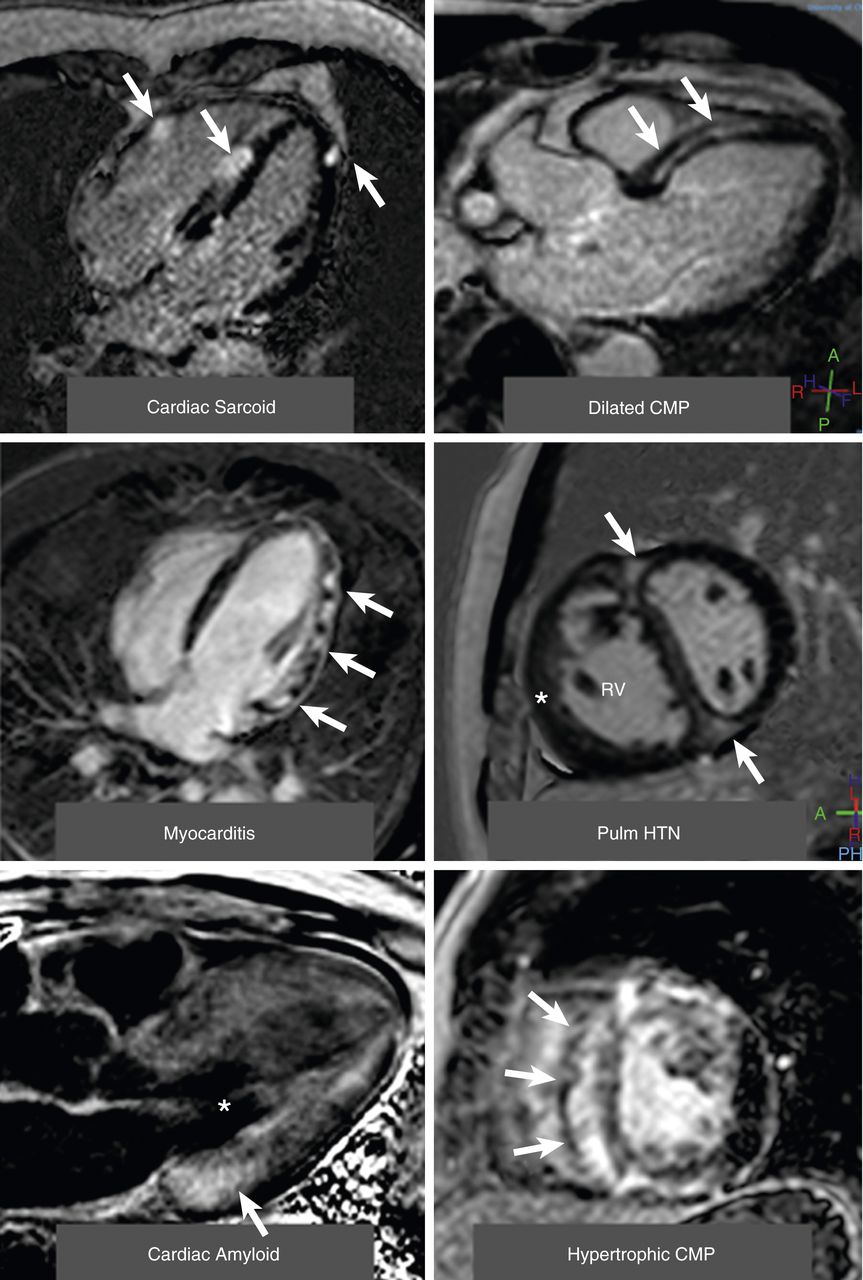
(Top left) A 4-chamber view of patchy distribution of late midwall and epicardial late gadolinium enhancement (LGE) (arrows) in a patient with cardiac sarcoidosis. (Top right) A 3-chamber view of a midwall stripe pattern of late gadolinium enhancement (arrows) in a patient with dilated cardiomyopathy. (Middle left) A 4-chamber view of patchy epicardial and midwall late gadolinium enhancement along the lateral wall (arrows) in a patient with myocarditis. (Middle right) A midventricular short-axis image in a patient with pulmonary hypertension (HTN) with right ventricular (RV) dilation and hypertrophy (*) along with late gadolinium enhancement in the anterior and inferior right ventricular insertion points (arrows). (Bottom left) A 3-chamber view of a LGE image in a patient with cardiac amyloid. The left ventricular blood pool is nulled (*), and there is subtle circumferential subendocardial late gadolinium enhancement throughout the left ventricle. The late gadolinium enhancement is most pronounced at the base of the left ventricle within hypertrophied myocardium (arrow). (Bottom right) A midventricular short-axis image in a patient with hypertrophic cardiomyopathy with evidence of asymmetrical septal hypertrophy with extensive midwall LGE within the hypertrophied myocardium (arrows). CMP = cardiomyopathy.
Patel A.R. et al Role of Cardiac Magnetic Resonance in the Diagnosis and Prognosis of Nonischemic Cardiomyopathy JACC: Cardiovascular Imaging
Volume 10, Issue 10 Part A, October 2017