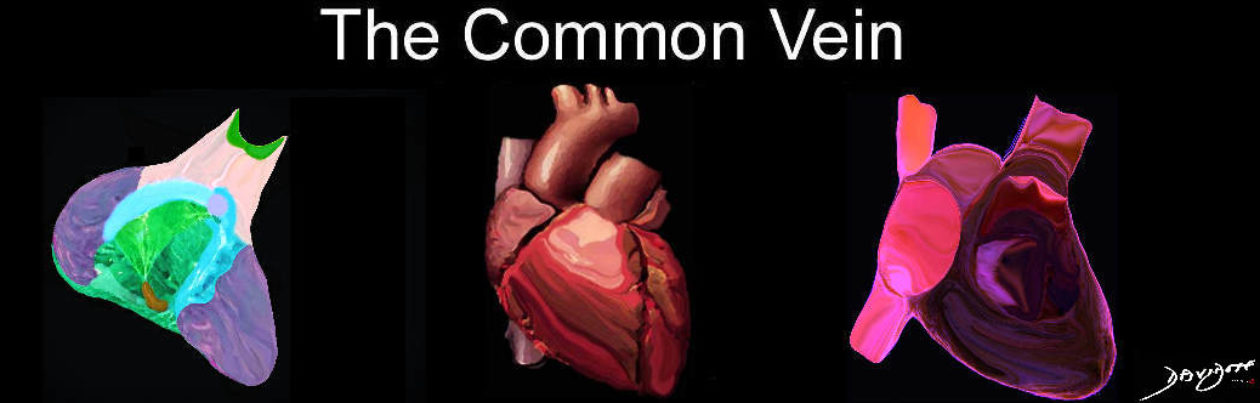
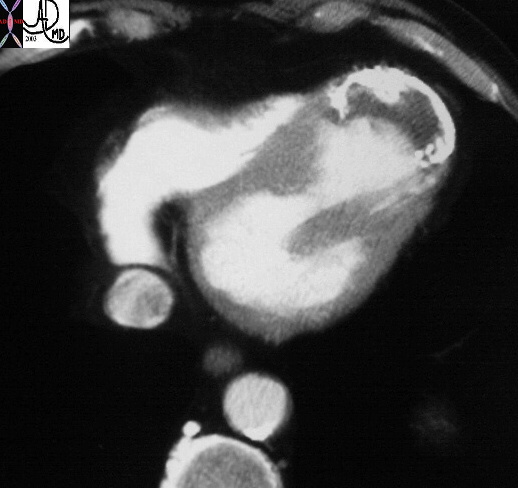
Normal CT
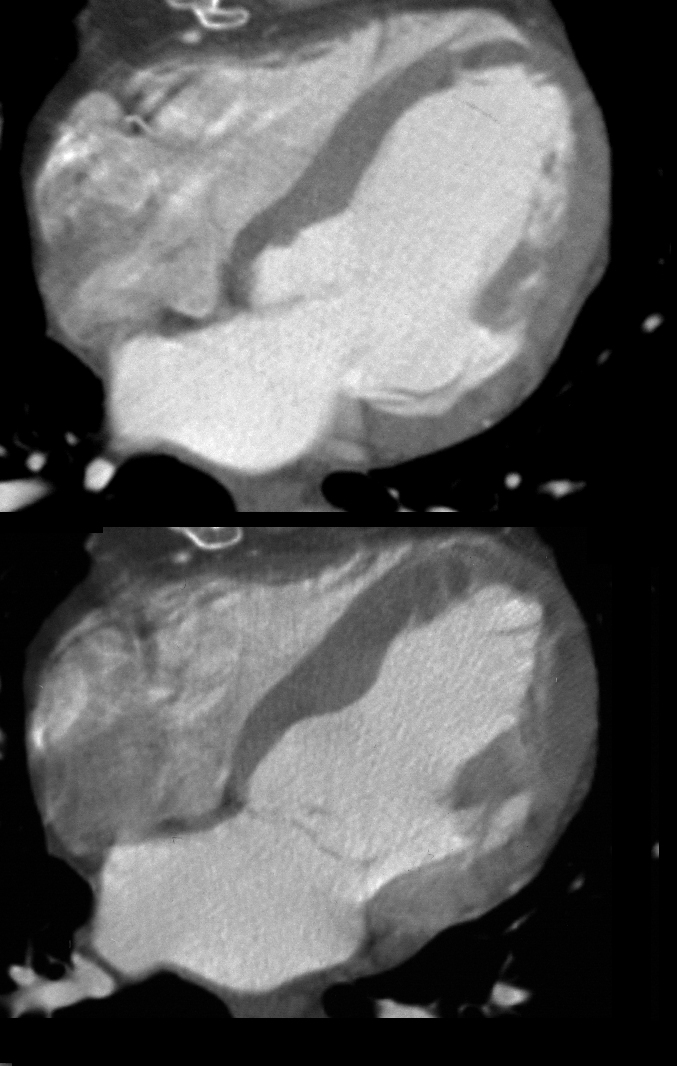
Tags, LV, CT, systole, diastole,
Ashley Davidoff MD 24839c
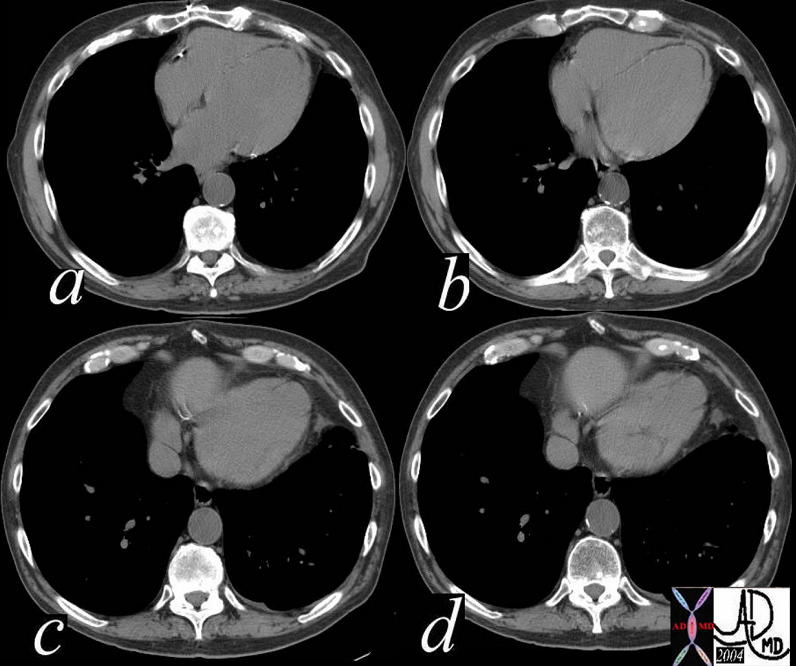
DILATED CARDIOMYOPATHY, DIABETES, CRF, PANCREATITIS
At the time of his first presentation with dyspnea his CXR showed perihilar infiltrates.
A CT confirmed progressive alveolar edema, with bilateral effusions (right greater than left), mild left ventricular dilatation, Kerley B lines and centrilobular densities and small pericardial effusion. Ashley Davidoff MD

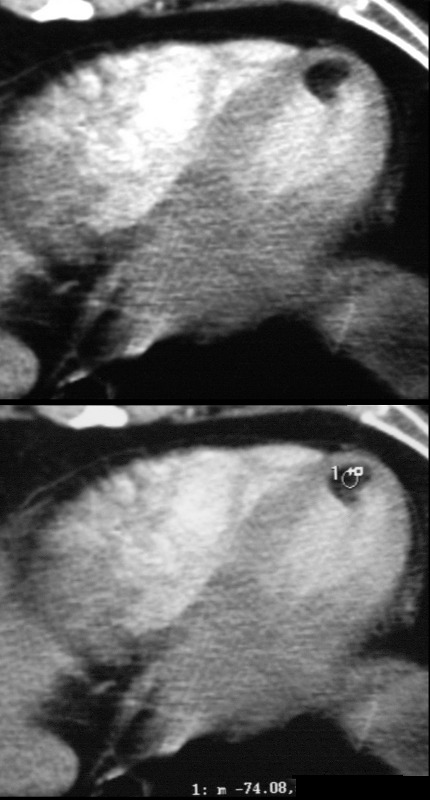
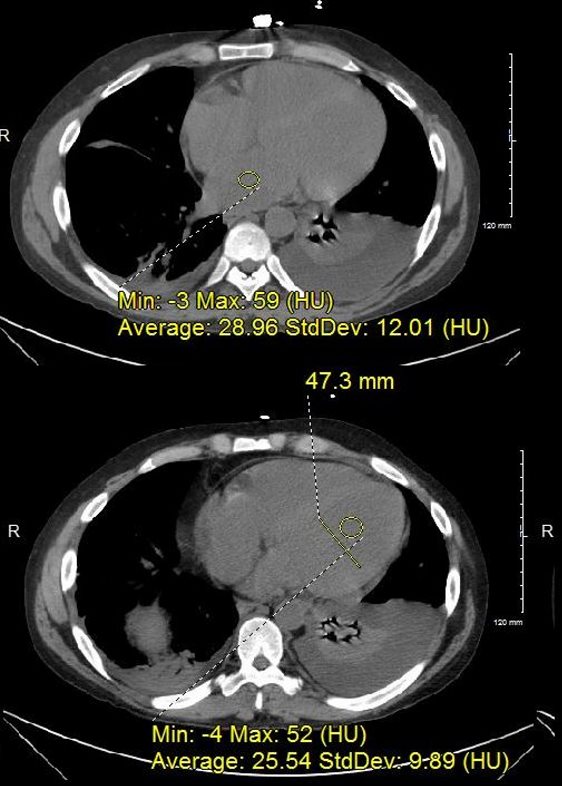
37 year old male with no history of CAD with a fat containing nodule at the LV apex most likely representing a lipoma of the myocardium
Ashley Davidoff MD
Subendocardial – Ischemia
Ashley Davidoff MD
Sarcoidosis
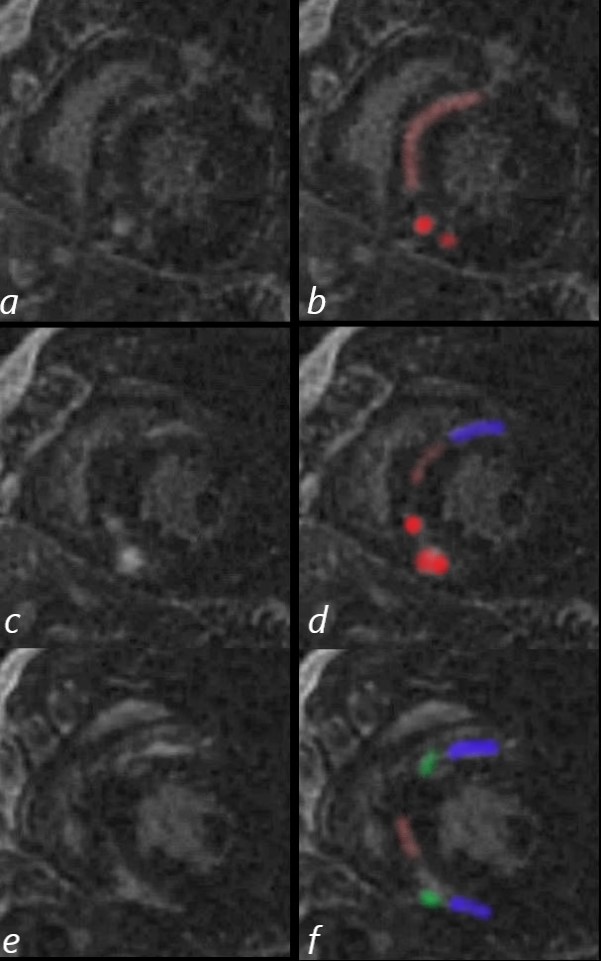
48-year-old man with a previous history of sudden loss of vision which subsequently resolved and presents now with near syncope, atrial fibrillation. MRI showed multifocal acute embolic infarcts involving the cerebellum. Echocardiogram showed an enlarged left atrium, significant left ventricular hypertrophy, and moderate mitral regurgitation.
CXR shows LAE and LVE with cephalisation
The MRI shows multifocal linear and nodular LGE at the hinge points (green) in the subepicardial regions (blue) at the base of the heart anteriorly and inferiorly, as well as mid myocardial linear LGE in the septum (pink). The bright LGE is dominant in the nodular form (red)
Diffuse hypokinesis, LVH (95gms/sq m) EF of 39%, moderate mitral regurgitation, and significant left atrial enlargement
Sarcoidosis is though to be most likely together with nonspecific hypertrophic cardiomyopathy . Distribution of LGE is not characteristic of Fabry disease. Amyloidosis is also considered as a less likely possibility
Ashley Davidoff MD
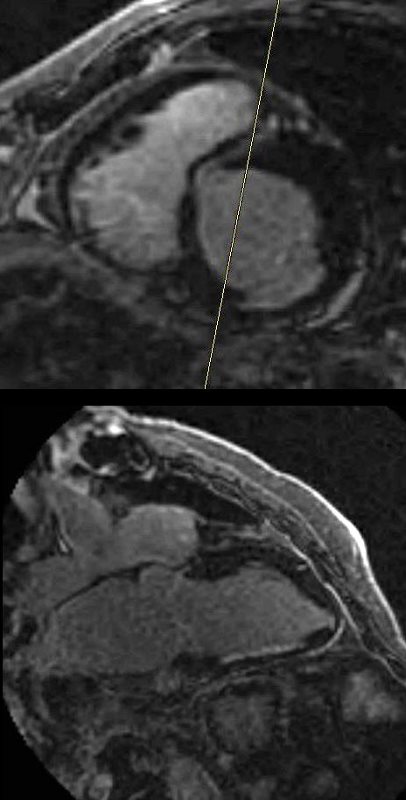
Dilated Cardiomyopathy
2 Chamber LGE sequence shows linear mid myocardial LGE in the ventricular septum
Ashley Davidoff MD
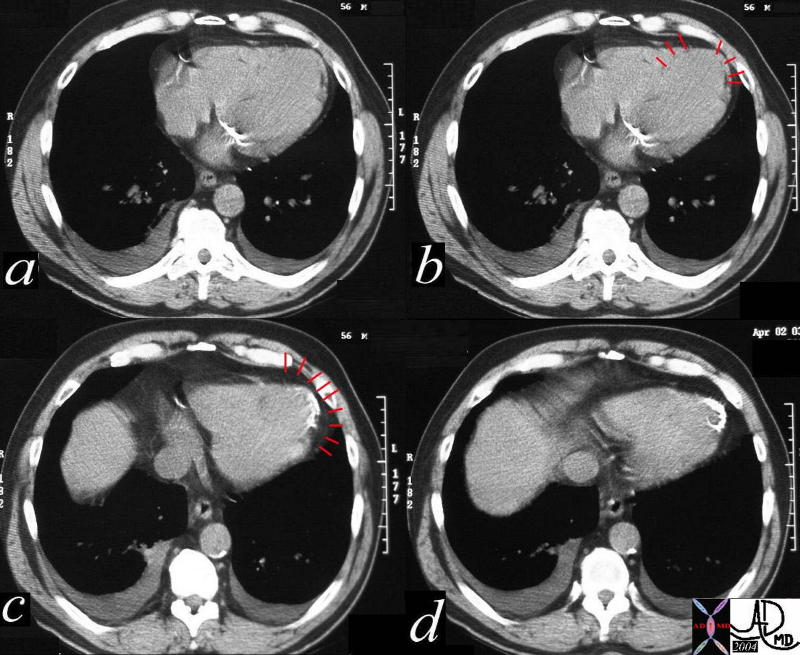
Amyloidosis
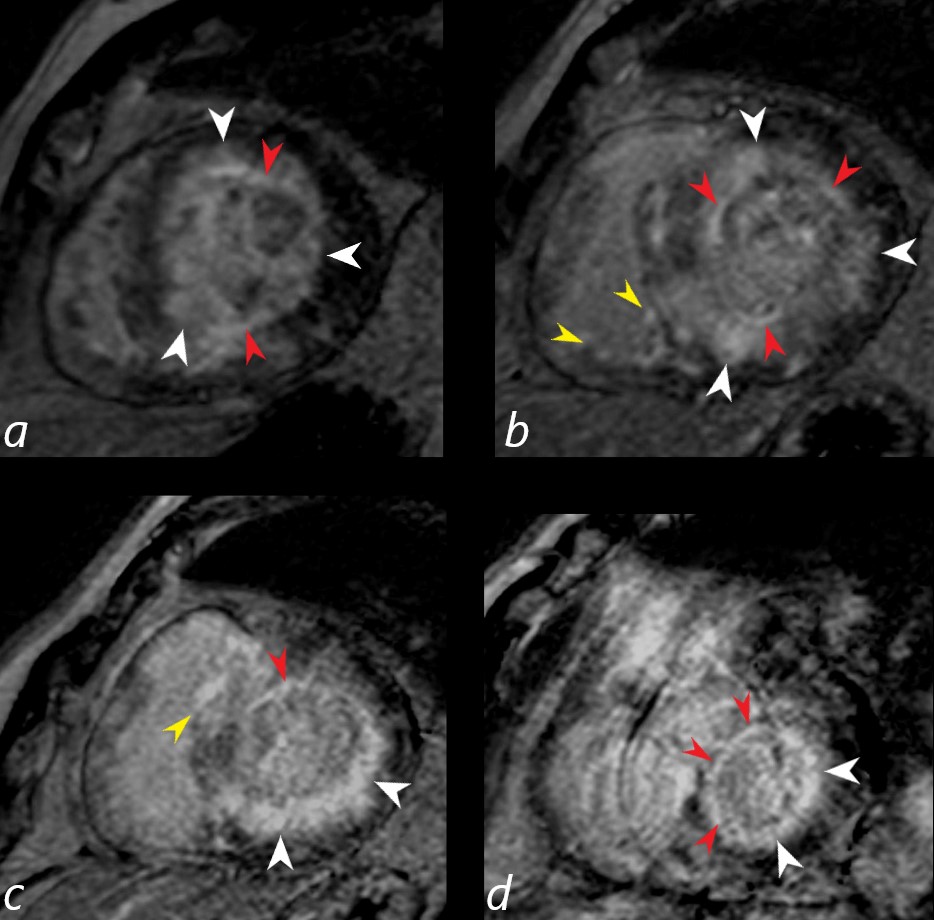
Gated short axis delayed gadolinium sequence through the base LV during diastole and shows subendocardial LGE (red arrowheads in a,b,c, and d, diffuse mid myocardial LGE (white arrowheads) (a,b,c,d) and subepicardial LGE in the RV (yellow arrowheads (b,c)
Ashley Davidoff MD
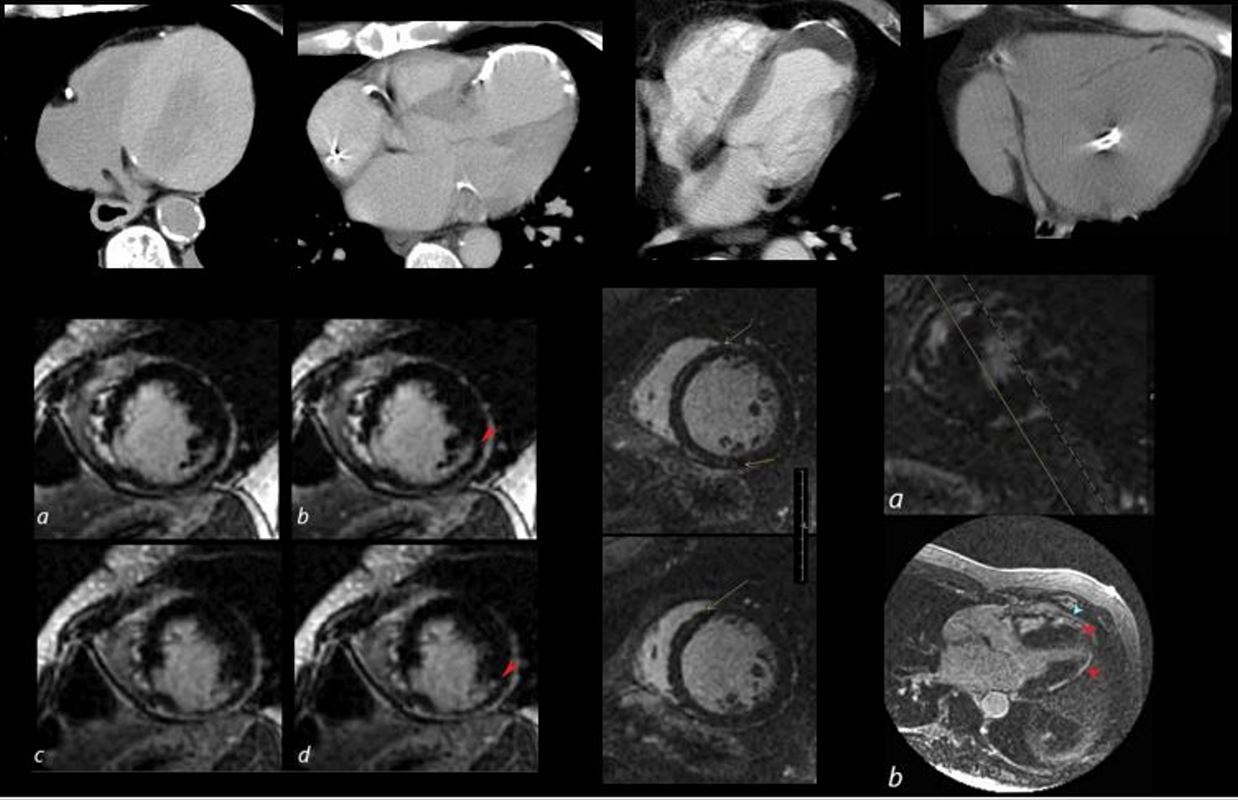
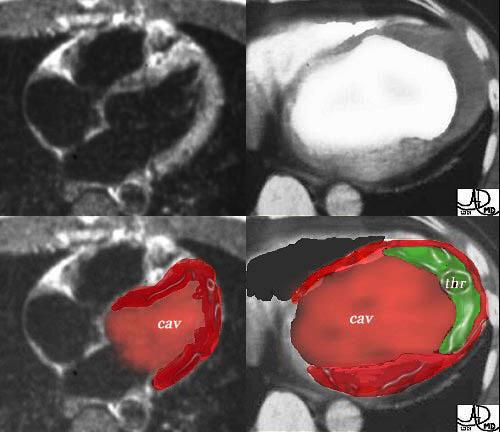
The collage reveals the variation in the tissue characterization of the LV in disease
Top row (from l to r) Patient with anemia showing low density of the blood and soft tissue density of the thickened myocardium. The 2nd image shows a calcified apical aneurysm. The 3rd image is a calcified aneurysm of the apex with thrombus in the lumen. The 4th image shows fat in the septum and the apex reflecting a previous MI in this region
2nd row 1st image is an MRI showing subendocardial delayed gadolinium enhancement (LGE) in a patient with a prior infarct of the inferolateral portion of the LV. The middle image shows a dilated LV with mid myocardial LGE in a patient with congestive cardiomyopathy. The last image shows multicentric linear and nodular LGE prominent in the subepicardial region and consistent with sarcoidosis.
heart 0086
Ashley Davidoff MD
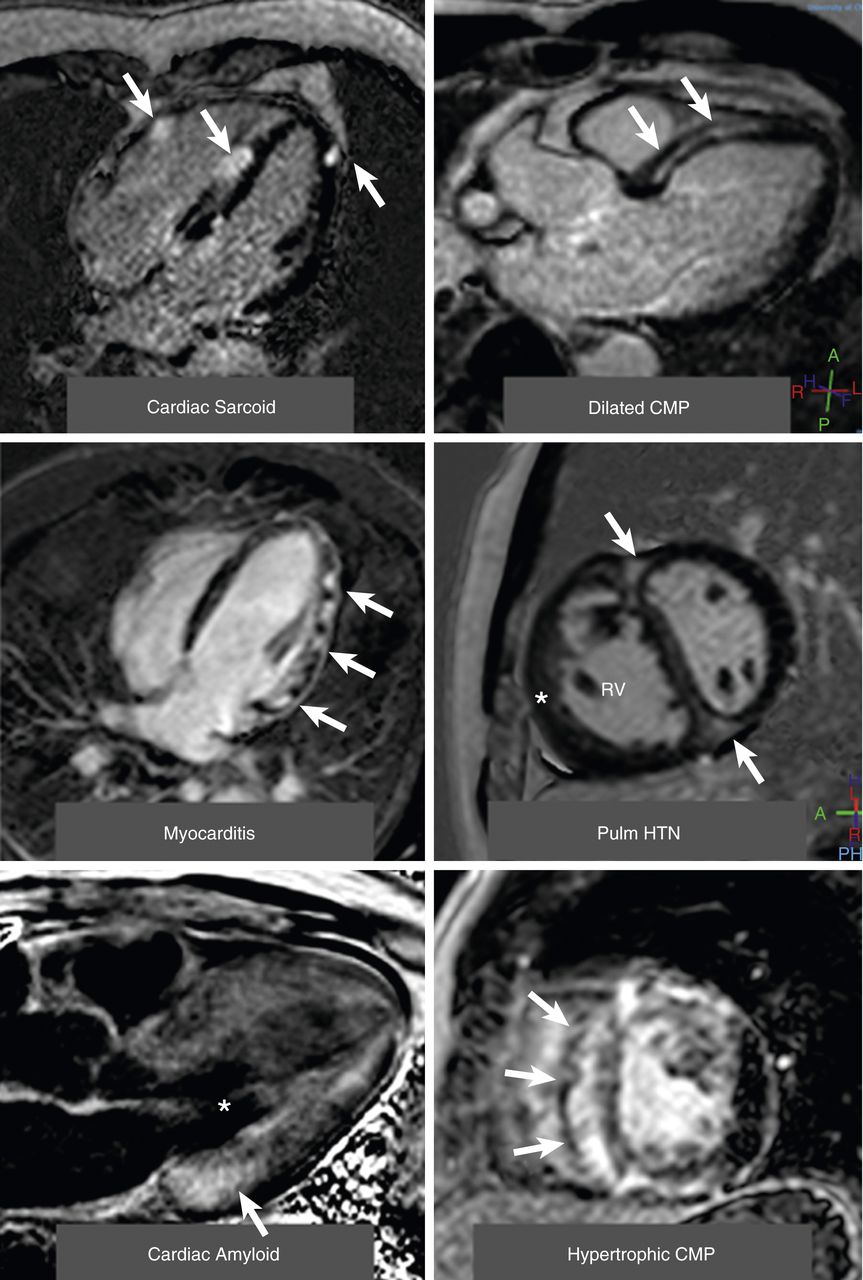
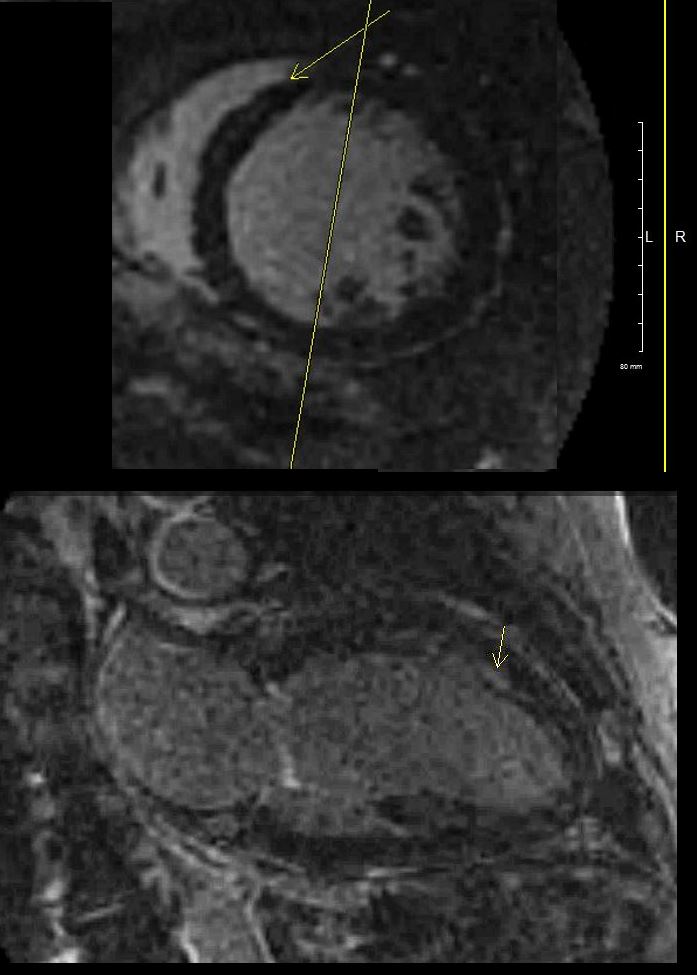
(Top left) A 4-chamber view of patchy distribution of late midwall and epicardial late gadolinium enhancement (LGE) (arrows) in a patient with cardiac sarcoidosis. (Top right) A 3-chamber view of a midwall stripe pattern of late gadolinium enhancement (arrows) in a patient with dilated cardiomyopathy. (Middle left) A 4-chamber view of patchy epicardial and midwall late gadolinium enhancement along the lateral wall (arrows) in a patient with myocarditis. (Middle right) A midventricular short-axis image in a patient with pulmonary hypertension (HTN) with right ventricular (RV) dilation and hypertrophy (*) along with late gadolinium enhancement in the anterior and inferior right ventricular insertion points (arrows). (Bottom left) A 3-chamber view of a LGE image in a patient with cardiac amyloid. The left ventricular blood pool is nulled (*), and there is subtle circumferential subendocardial late gadolinium enhancement throughout the left ventricle. The late gadolinium enhancement is most pronounced at the base of the left ventricle within hypertrophied myocardium (arrow). (Bottom right) A midventricular short-axis image in a patient with hypertrophic cardiomyopathy with evidence of asymmetrical septal hypertrophy with extensive midwall LGE within the hypertrophied myocardium (arrows). CMP = cardiomyopathy.
Patel A.R. et al
Role of Cardiac Magnetic Resonance in the Diagnosis and Prognosis of Nonischemic Cardiomyopathy
JACC: Cardiovascular Imaging
Volume 10, Issue 10 Part A, October 2017