LECTURE HEART CXR CT MRI CARDIOMYOPATHY
The Cardiac Evaluation on the CXR – PA
First step – Is the heart enlarged?
- Cardiothoracic ratio as a global method
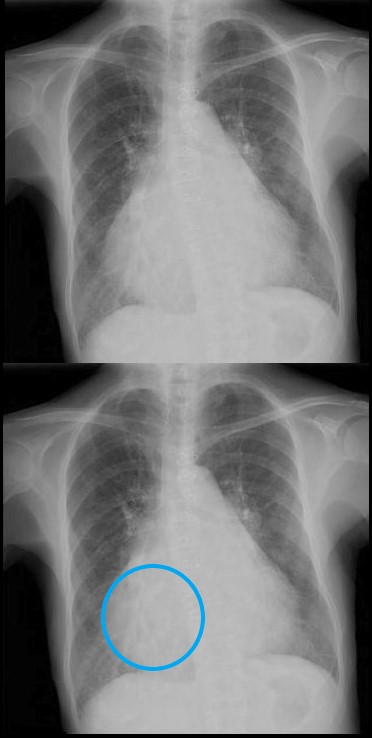
Cardiothoracic Ratio
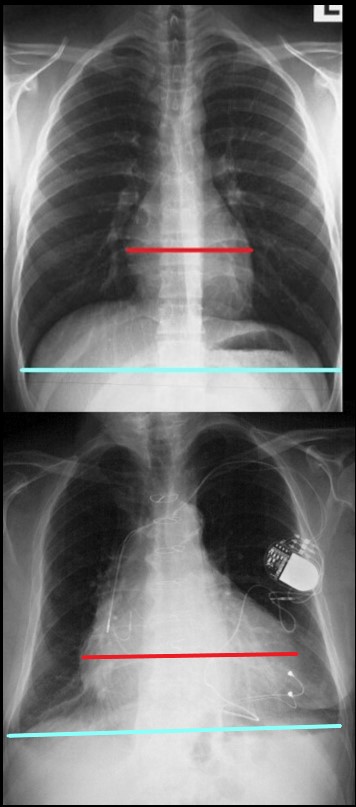
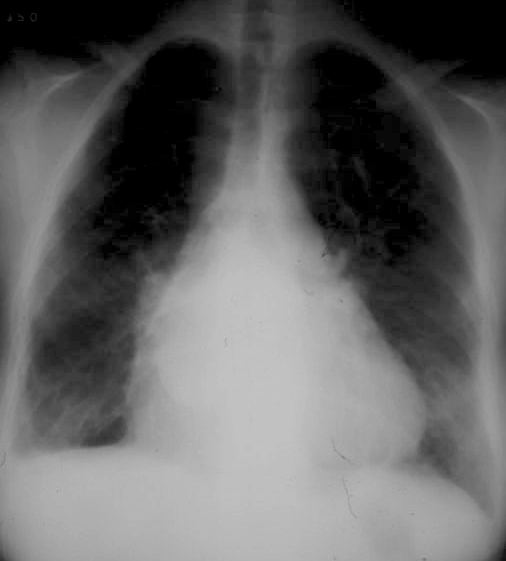
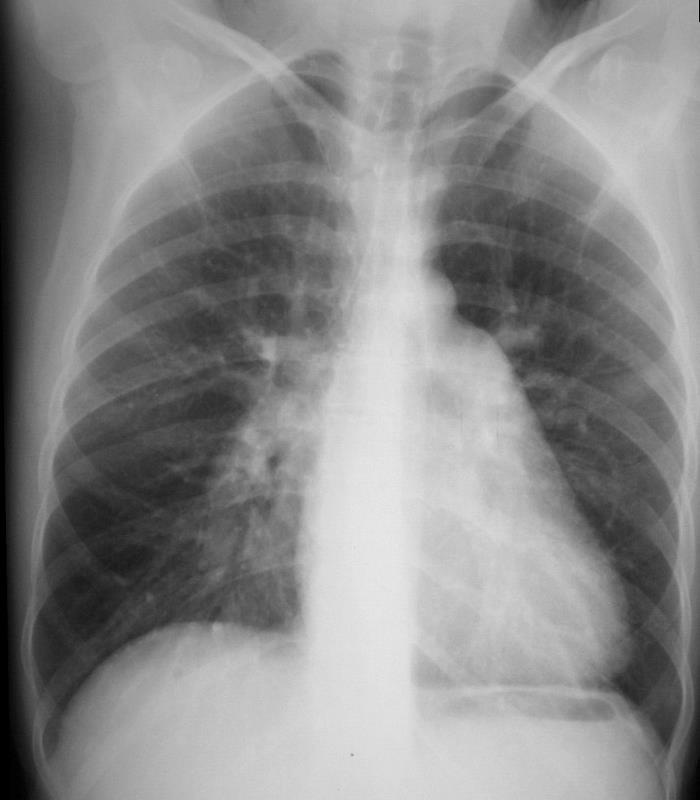
The maximum transverse length of the heart is expressed as a percentage of the maximum length of the internal diameter of the chest. When this ratio – the cardiothoracic ratio (c t r) is greater than 50% cardiomegaly is present. The top image is normal and the bottom reflects cardiomegaly
Ashley Davidoff MD
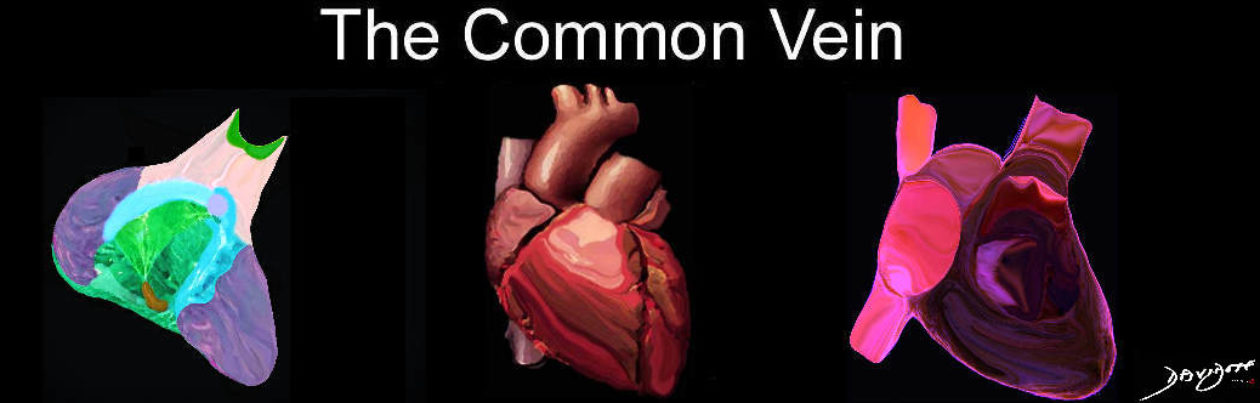
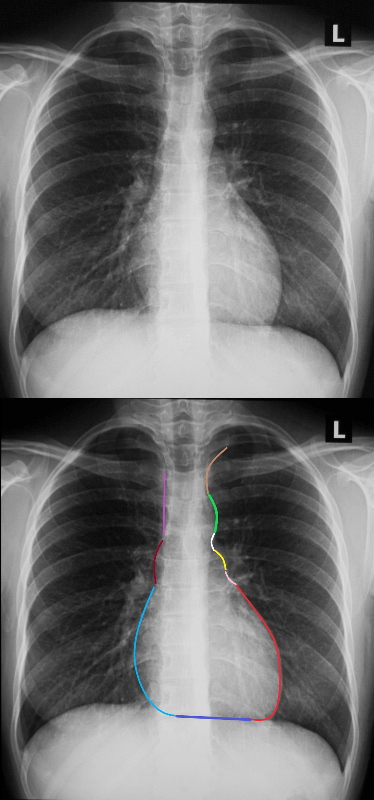
Border Forming Parts of the Heart
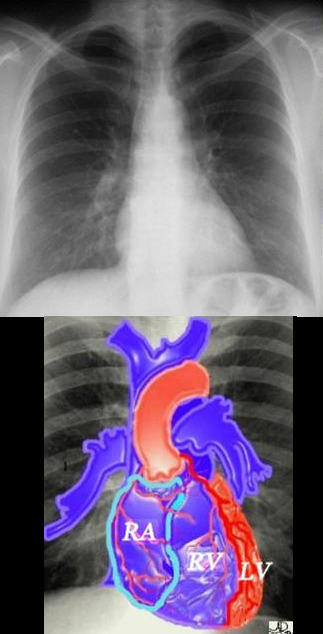 FRONTAL CXR AND PARTS OF THE HEART
Two Basic Shapes of Cardiomegaly
-
- Oval down and outer of LV
- Triangular RV disease
- Each of the Chambers
- LA, LV, RA, V
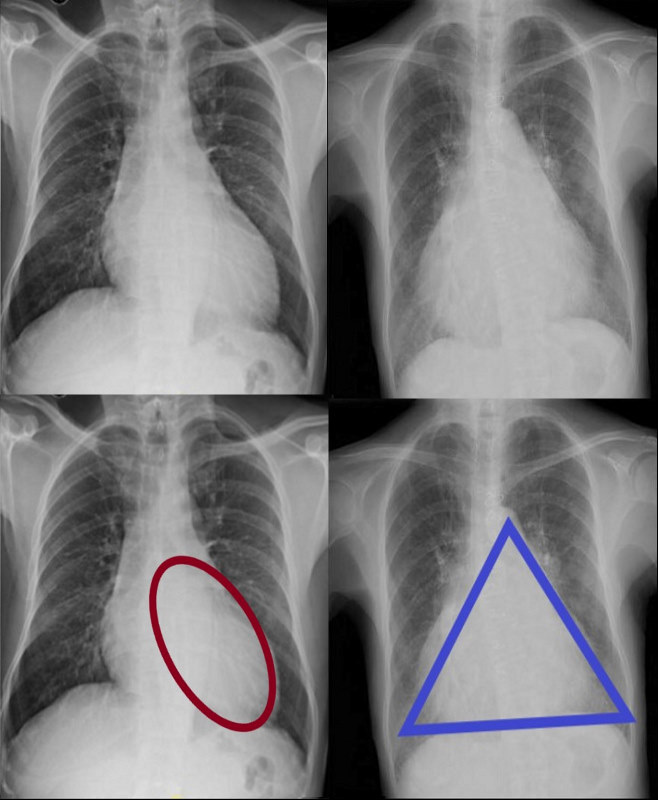
CARDIOMEGALY – TWO BASIC TYPES -OVOID and TRIANGULAR
The ovoid form which suggests left ventricular dominance and triangular form which suggests right ventricular dominance.
Ashley Davidoff MD
LVE
Subtle Ovoid Form Suggestive on the PA and Confirmed on the Lateral – Using Both Views
62 year old female with acute chest pain atrial fibrillation, hypotension admitted to ICU. Clinical evaluation was considered to be non-ischemic cardiomyopathy with EF by echo of about 20%. She was hypotensive and, in the ICU, and CXR showed acute CHF with cardiomegaly. The TEE was more in keeping with segmental dyssynergy, Cardiac cath showed occluded RCA bot good collateralization from the LAD. MRI showed subendocardial LGE in the inferior and inferolateral portions of the LV consistent with a prior infarction and EF of 20%
Ashley Davidoff MD
Triangular Heart with RVE
With Mitral Stenosis
Triangular shaped heart with RVE LAE
Ashley Davidoff MD
With Pulmonary Hypertension
Frontal x-ray with triangular shaped heart due to pulmonary hypertension with enlarged MPA and enlarged descending RPA .
Ashley Davidoff MD
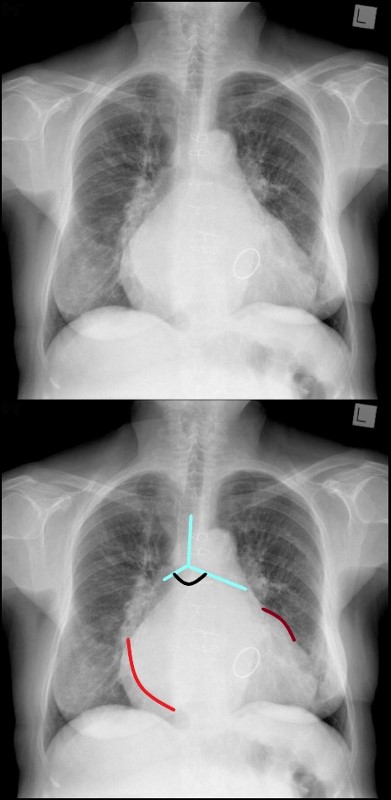
The Enlarged Left Atrium
Widened Carinal Angle
Double Density
Straightened right Heart Border – prominent LA appendage
Triangular Heart
Right Atrial Enlargement
-
- enlarged, globular heart
- narrow pedicle
- gross enlargement of the right atrial shadow, i.e. increased convexity in the lower half of the right cardiac border
- right atrial convexity is more than 50% of the cardiovascular height
- right atrial margin is more than 5.5 cm from the midline
 RIGHT ATRIAL ENLARGEMENT ON FRONTAL X-RAY
The right atrium is the most difficult chamber to assess unless it is very large in which case it will present on the frontal CXR with a very large right paravertebral border. This is a 71 year old female person with rheumatic heart disease with pulmonary hypertension and tricuspid regurgitation hence resulting in a large right atrium (RAE)
Ashley Davidoff MD
If there is time you may want to run through the collage of congenital heart disease cases
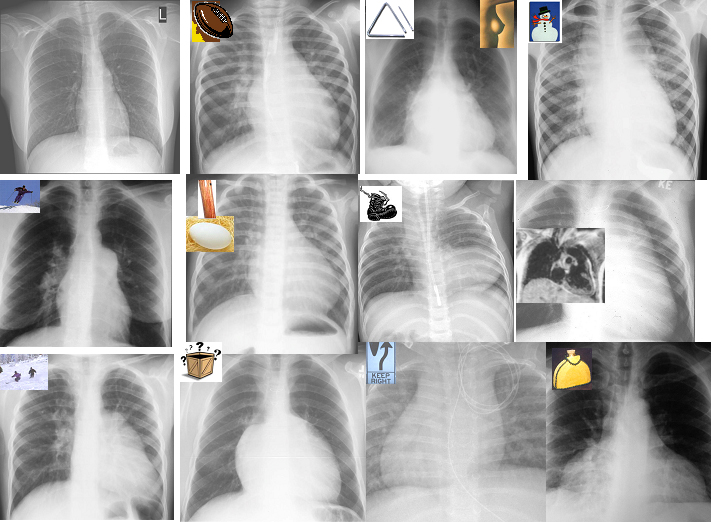
The Shapes of the Heart in Health and Disease
From top left ti right and across the rows they are: The normal heart , the “football” of LV enlargement the “triangle” or “proud breast” of RV enlargement, “snowman” of total anomalous pulmonary venous return, big PA mogul of pulmonary hypertension, “egg on its side” of D transposition of the great vessels, “boot shaped” heart seen in both pulmonary atresia and Tetralogy of Fallot, the long smooth combined Ao and PA mogul that has a differential diagnosis of L transposition, absence of the pericardium, and juxtaposition of the atrial appendages, the box shaped large heart of Ebstein’s anomaly, dextrocardia , and the water bottle” heart of a large pericardial effusion.
07197 Images are a combination of images from a personal collection and borrowed from the internet for educational purposes only. Some of the sources are unknown and are used for educational purposes alone 86774b02
TCV Links for extra info
The Cardiac Evaluation on the CXR -Lateral Exam
Normal and Abnormal
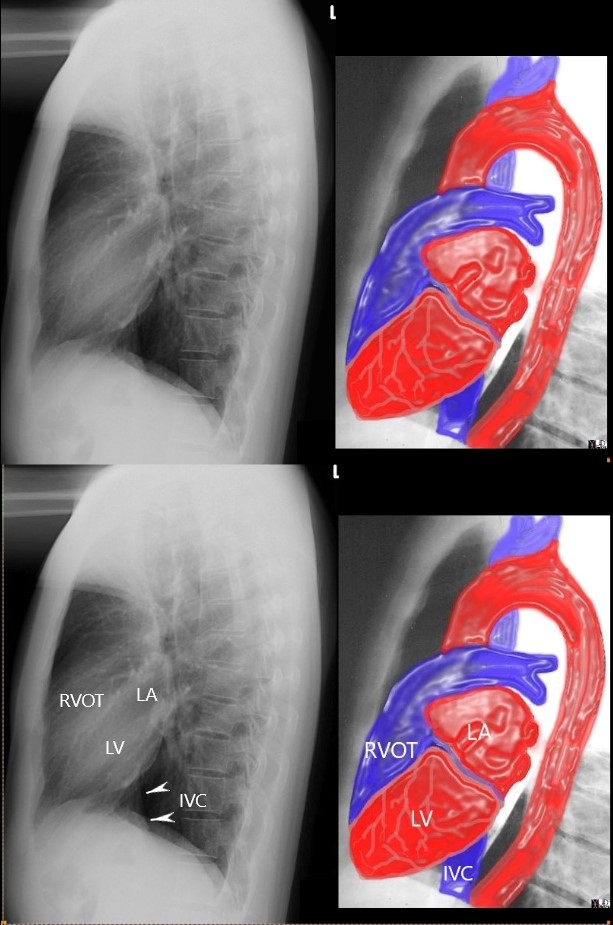
THE CV STRUCTURES VISIBLE ON THE LATERAL EXAM –
Ashley Davidoff MD
RULE OF 1/3 rds
- Normal Anteriorly
- RV takes up 1/3 of retrosternal space ((Sternomanubrial jn to xiphi)
- Inferiorly
- LV takes up 1/3 of the hemidiaphragm
- Posteriorly
- LA 1/3, LV 2/3

the anterior border of the chest is divided into thirds; 1/3 for the RVOT and 2/3 for the retrosternal air space
the posterior border of the heart is divided into thirds; 1/3 for the LA and 2/3 for the LV.
the diaphragmatic border is divided into thirds; 1/3 for the LV and 2/3 for the rest of the diaphragm
Ashley Davidoff MD
15416C02Wlateral.8 rule of thirds
- Abnormal
-
- Anteriorly
- RVE
- RV > 1/3 of retrosternal space
- RVE
- Posteriorly
- LAE
- LA >1/3 of posterior heart border
- Also elevates left main stem bronchus
- LAE
- Anteriorly
-
Normal vs Abnormal – Left Ventricular Enlargement
 Assessment of the Size of the left Ventricle (LV) on the Lateral CXR
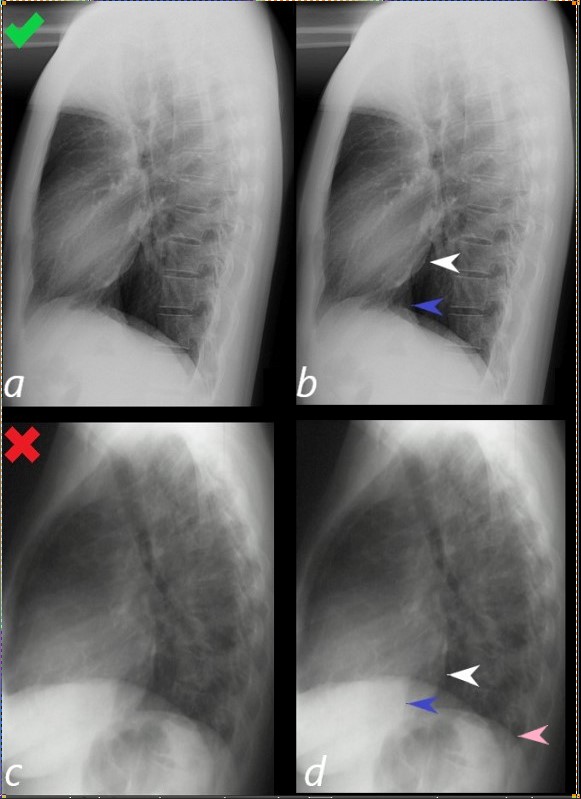
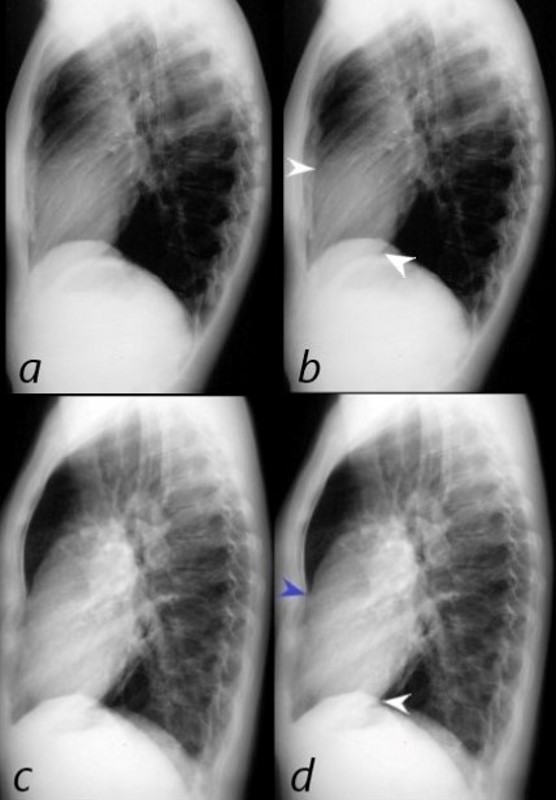
Lateral examination of a chest x-ray (CXR) shows the normal in the upper row (a,b) and the abnormal and enlarged in the bottom row (c,d).
The objective evaluation is based on the relative positioning and size of the LV (white arrowhead) in relation to the IVC, (blue arrowhead), and the left hemidiaphragm (pink arrowhead)
Ashley Davidoff MD
15416C02Wlateral LV01L.8
RVE
 NORMAL and RVE
The normal lateral CXR (a,b), shows anterior and superior border of the heart (anterior white arrowhead) occupying 1/3 of the border between the sternomanubrial junction and the diaphragm.
The posterior and inferior white arrowhead shows the posterior border of the heart occupied by the RV taking up 1/3 of the distance of the diaphragm.
Images c and d represent left ventricular enlargement showing that the LV occupies about half the length of the diaphragm, (red arrowhead) while the retrosternal distance is unchanged and normal (white arrowhead).
Ashley Davidoff MD
Normal vs Abnormal – RVE and LAE
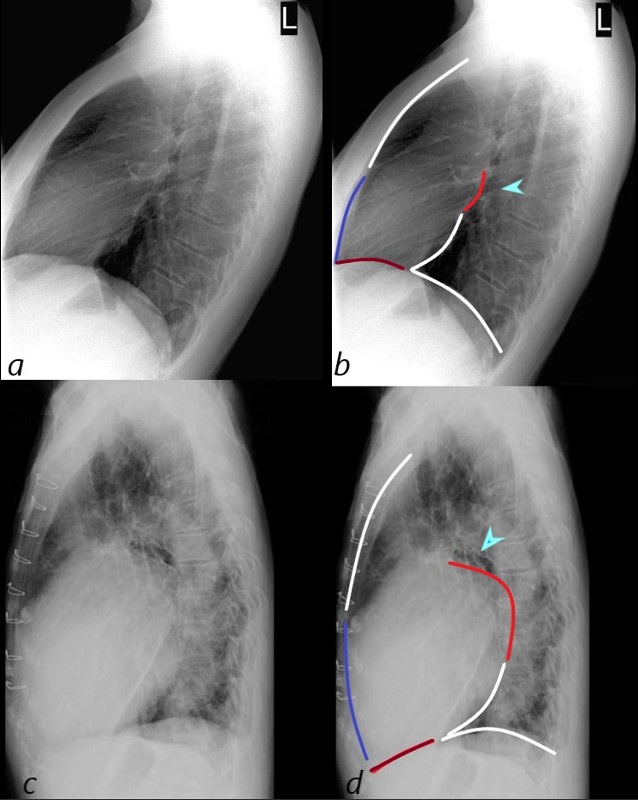 LATERAL EXAMINATION RVE AND LAE – MITRAL STENOSIS PULMONARY HYPERTENSION AND COR BOVINUM
71 year old Asian female with rheumatic heart disease dominated by calcific mitral stenosis mild MR, moderate tricuspid regurgitation
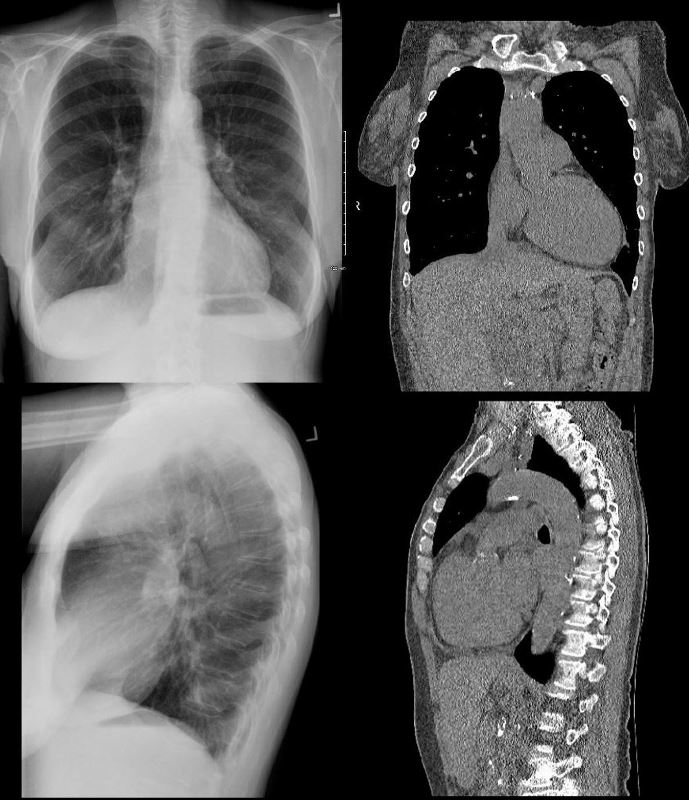
Right Atrial Disease on the Lateral _ Only when it is very enlarged
Where is the Right Atrium?
In the normal patient the RA is not border forming and is not visible. It lies to the right and slightly inferior and anterior to the left atrium, posterior and superior to the right ventricle, and to the right and superior to the left ventricle
Ashley Davidoff MD
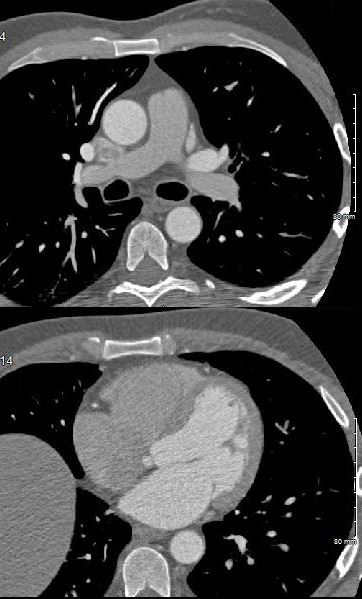
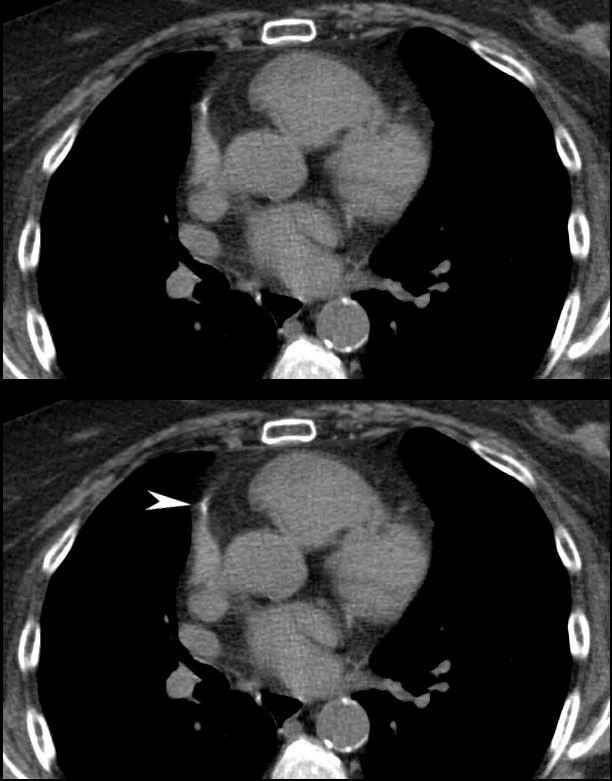
- Axial Imaging Explaining why the RA cannot be see on the Lateral –
- since it is neither anterior nor posterior border forming
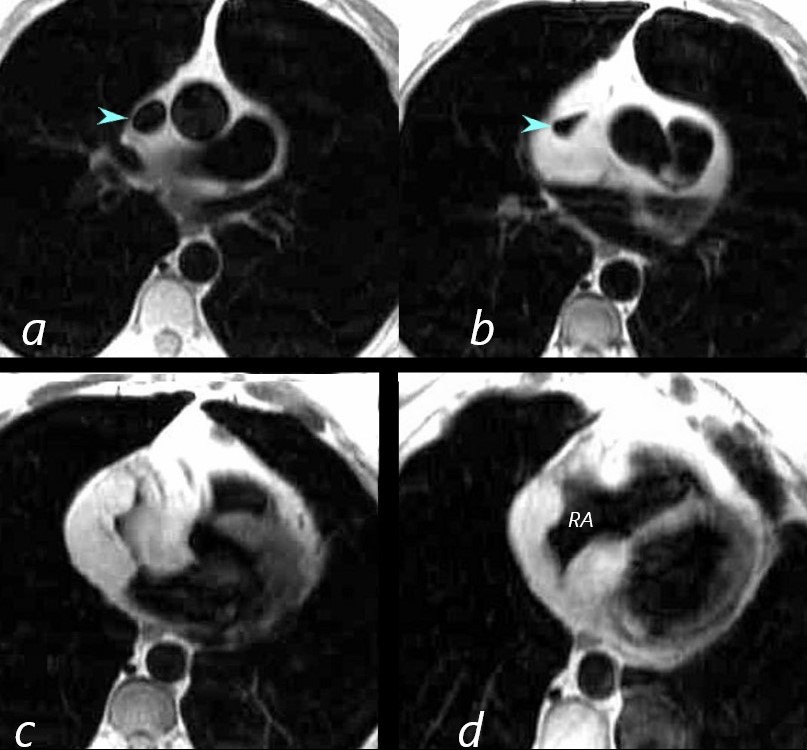
Axial images through the RA show the right atrial appendage in the top row and the body of the RA in the bottom row, neither of which would be visible on the lateral exam.
Ashley Davidoff MD
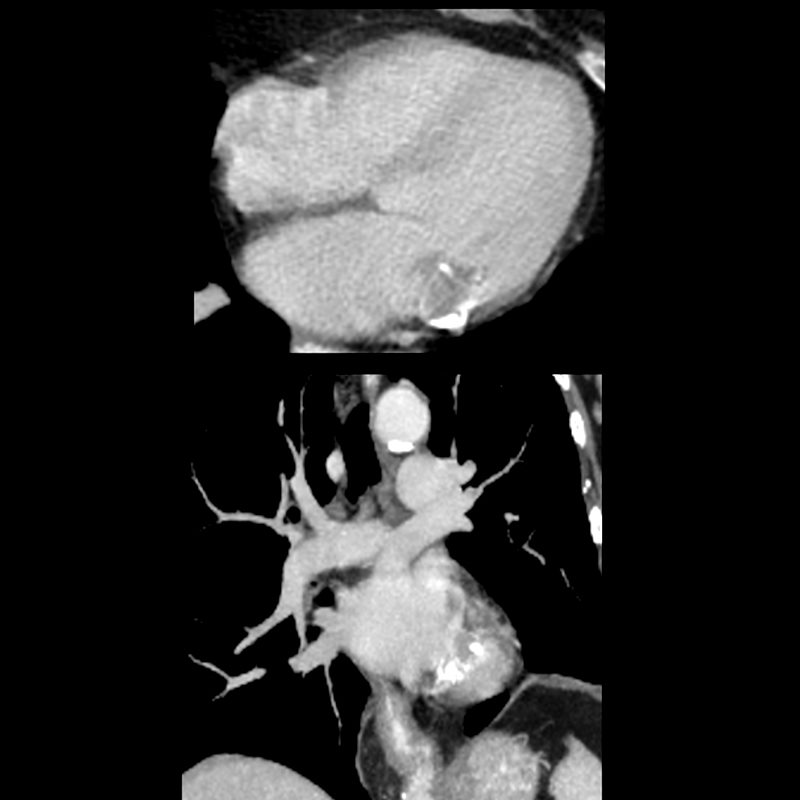
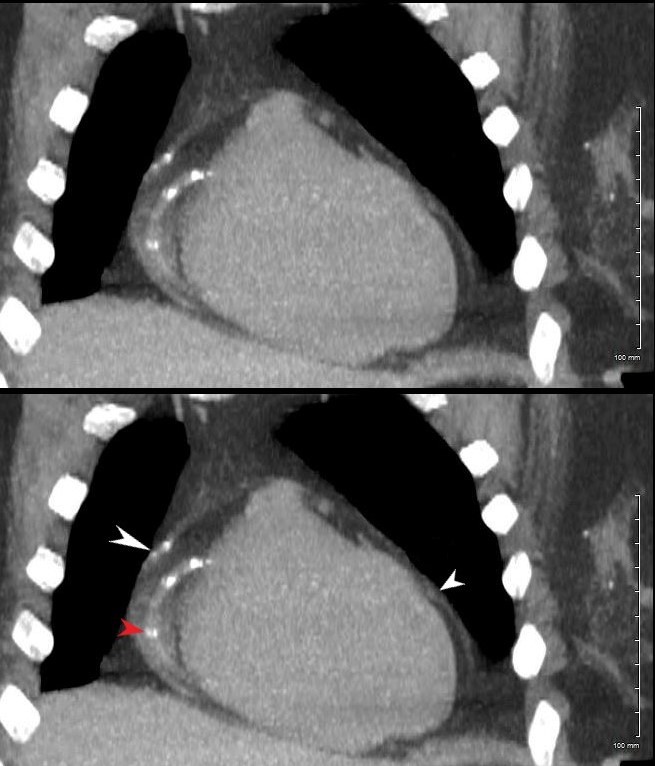
- When the RA enlarges-
- it moves laterally and anteriorly see CT below so that it can now be an anterior border forming structure
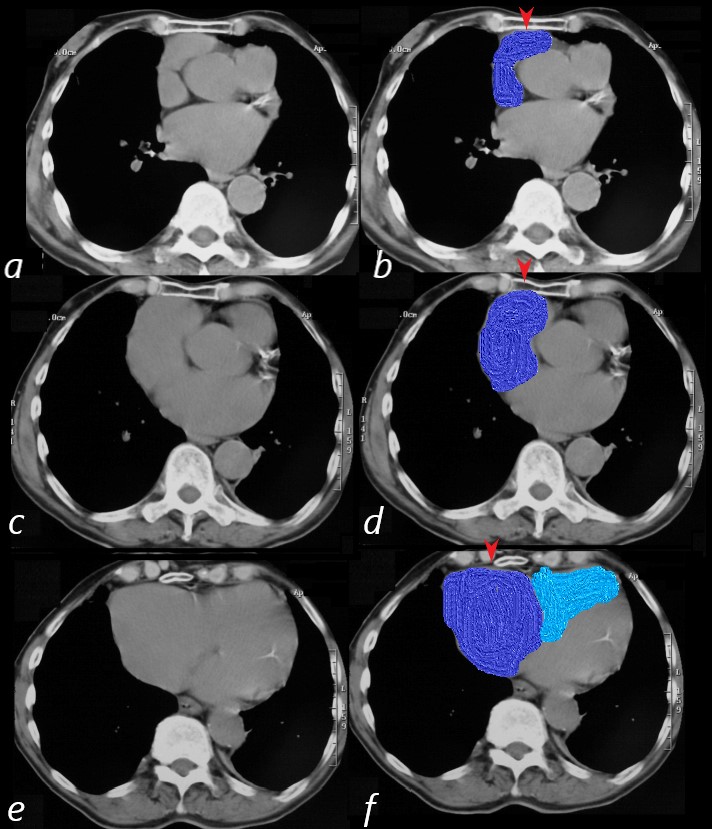
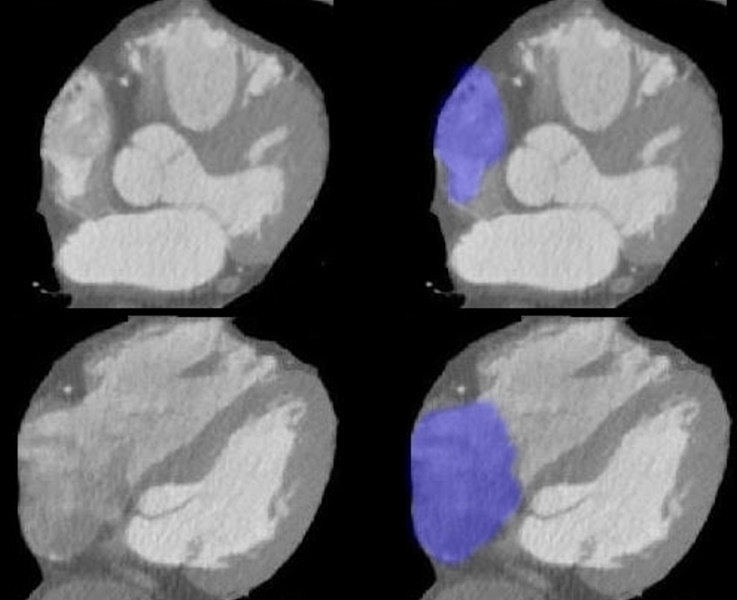
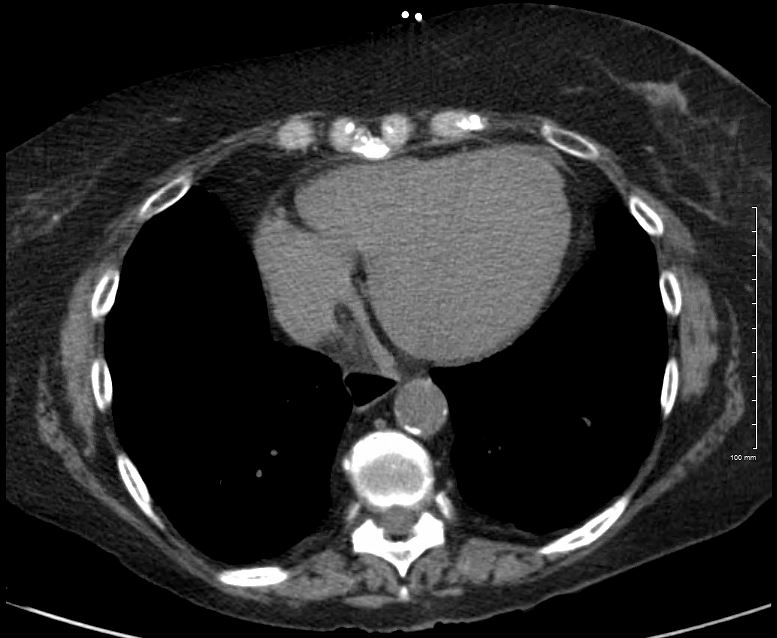
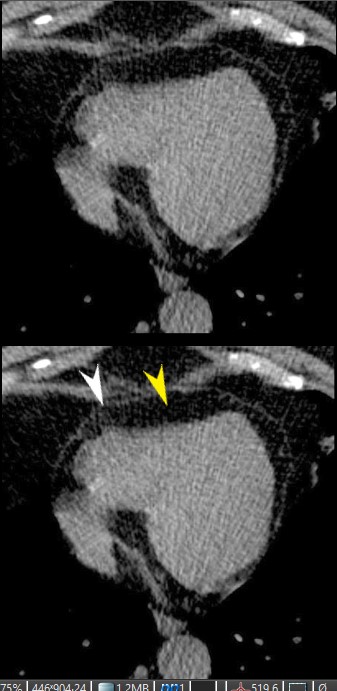
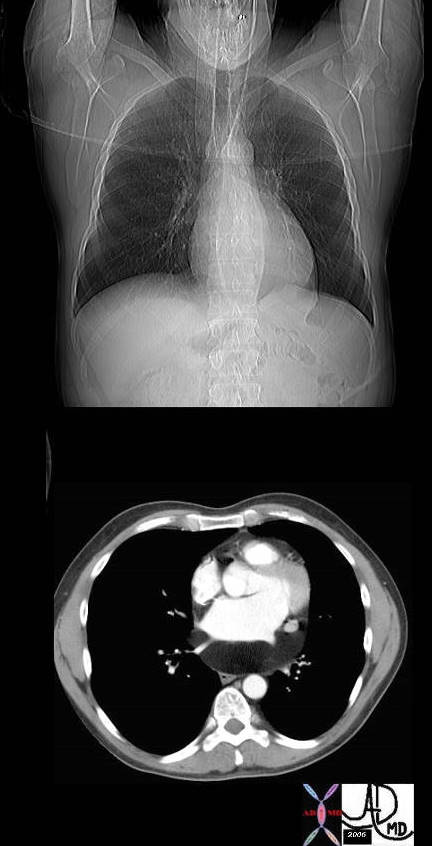
83-year-old male with significantly enlarged right atrium, as well as a mildly enlarged left atrium with evidence of CAD, atrial fibrillation and hypertension.
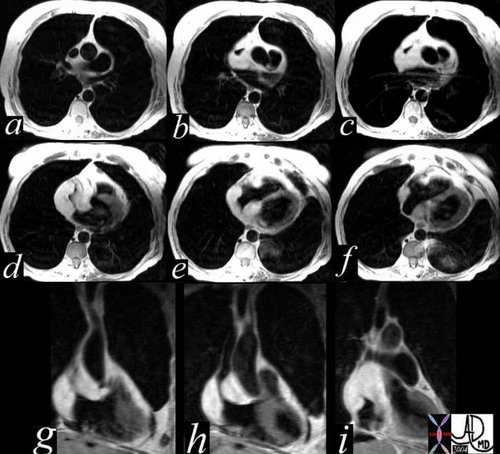
On CT scan the right atrium and appendage (blue overlay (b,d,f) are positioned against the anterior chest wall and sternum (red arrowheads). On the superior most images (b,d) the RV is not present and only takes up a retro-sternal position alongside the right atrium on the most inferior image (f)
Ashley Davidoff MD
RAE on the Lateral
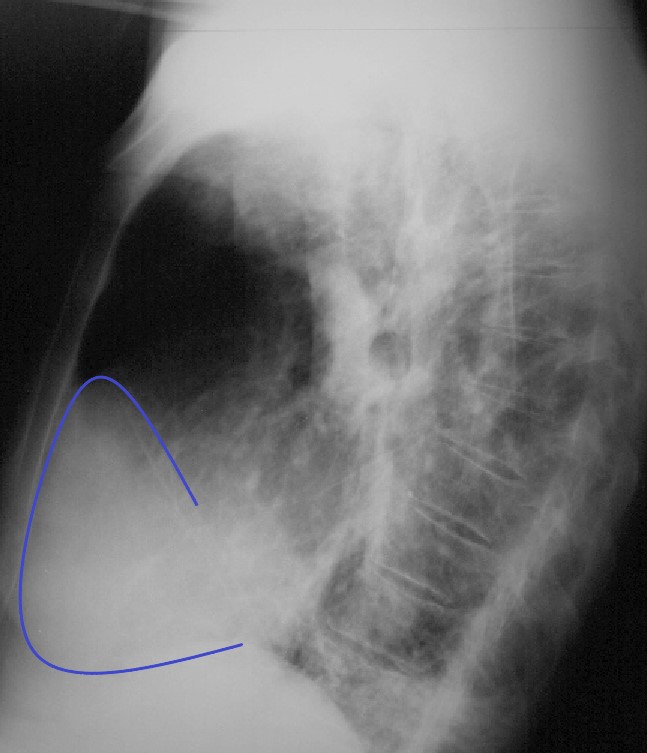
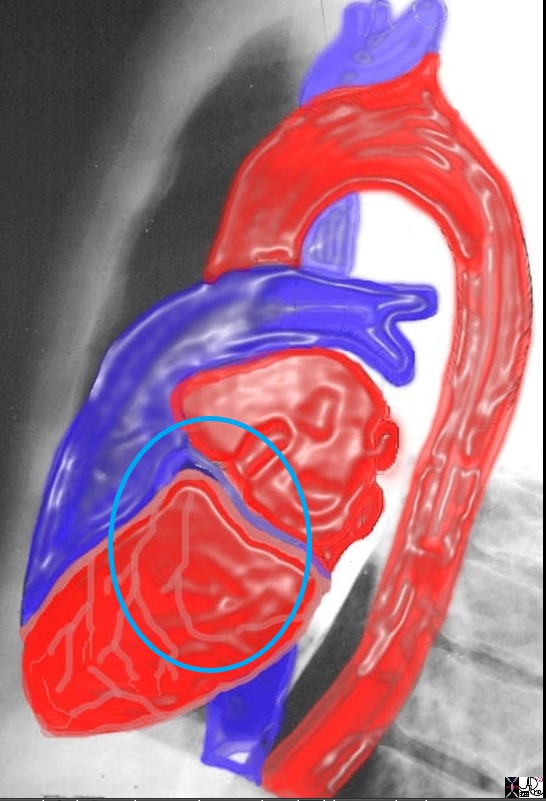
83-year-old male with significantly enlarged right atrium, as well as a mildly enlarged left atrium with evidence of CAD, atrial fibrillation and hypertension.
On the lateral CXR, the right atrium the blue line overlay indicates the position of the RV against the anterior chest wall. In addition, the right atrial appendage is so large (see CT below) that it lies against the sternum. The RA therefore occupies the entire retrosternal air space and results in decrease of the retrosternal airspace. This is the rare instance when the RA shares with, but dominates the anterior retrosternal position with the RV.
Ashley Davidoff MD
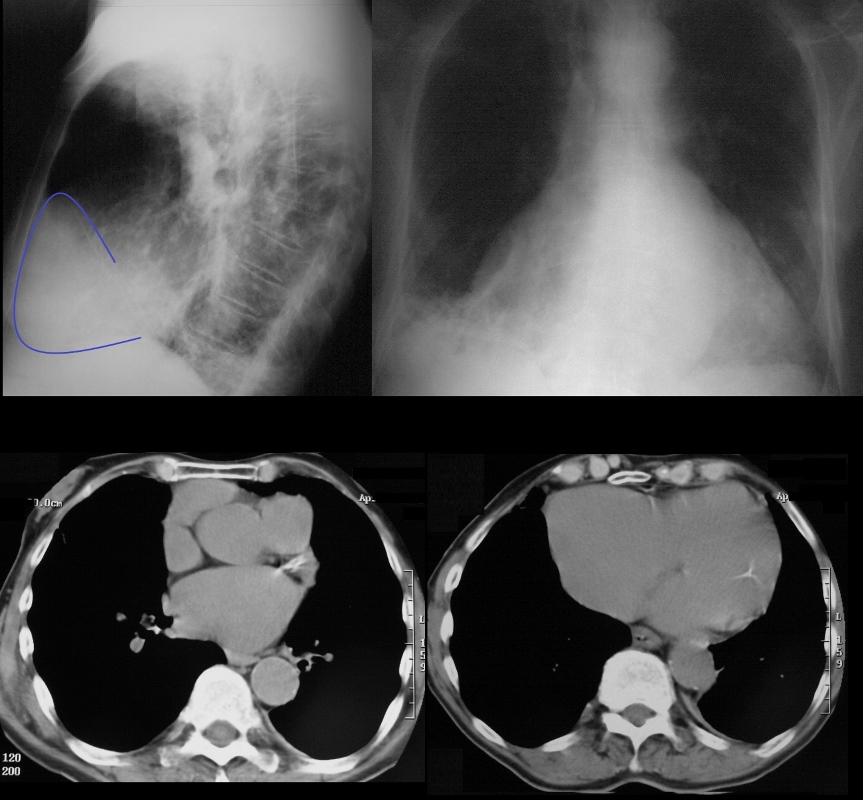
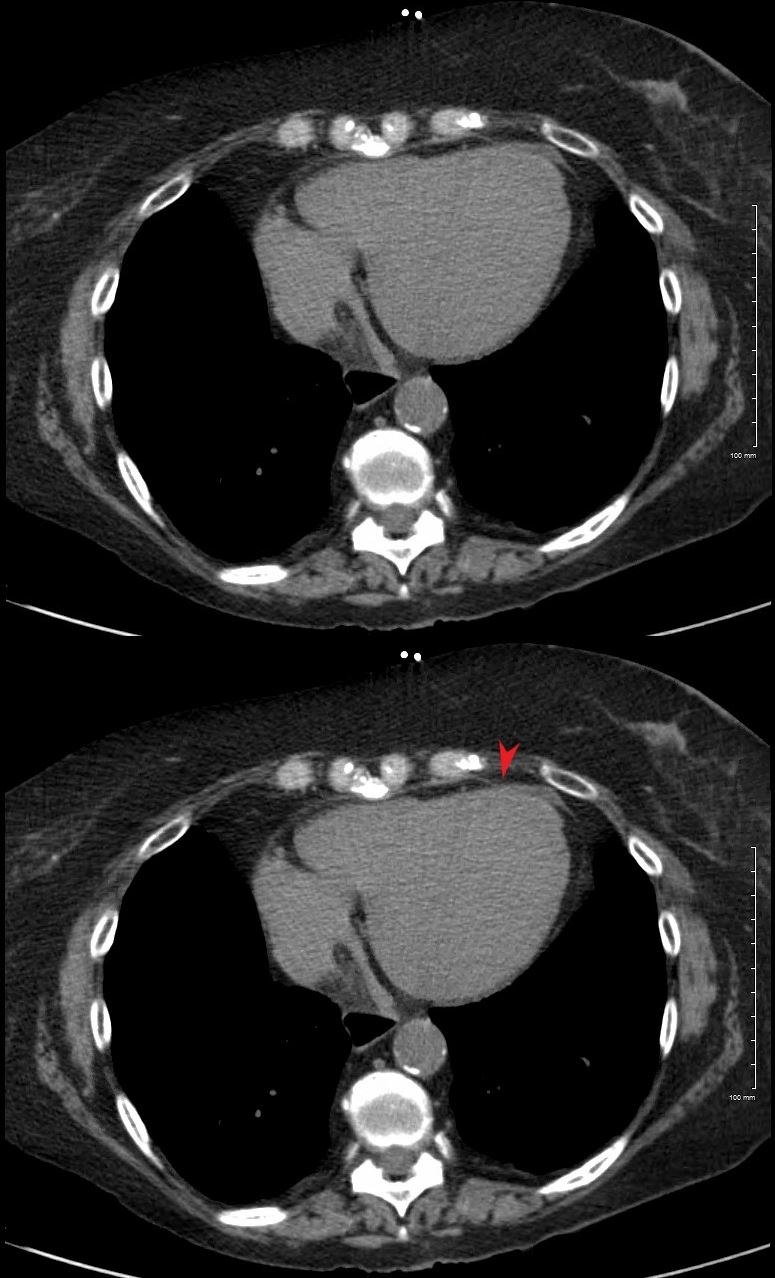
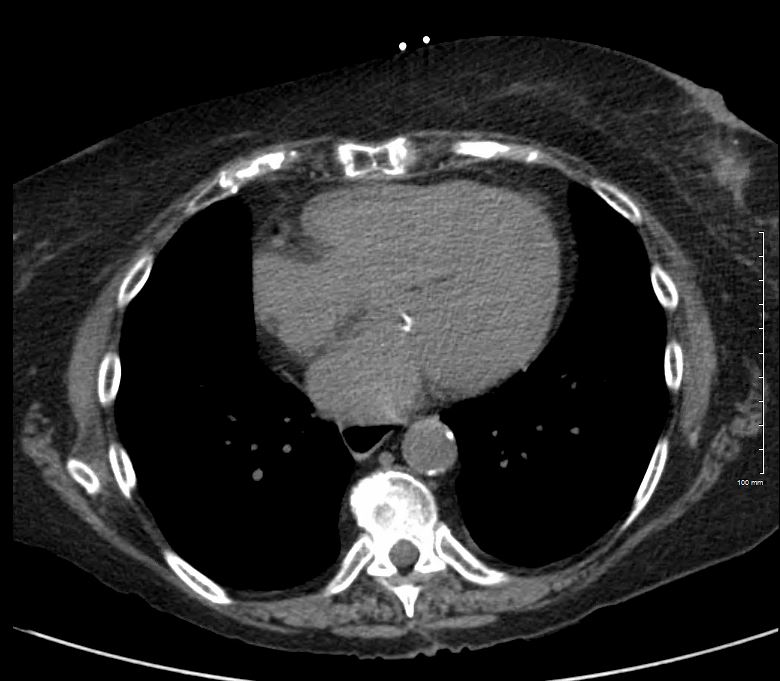
83 year old male with significantly enlarged right atrium, as well as a mildly enlarged left atrium with evidence of CAD, atrial fibrillation and hypertension.
On CT scan the right atrium is positioned against the anterior chest wall. In addition, the right atrial appendage is so large that it lies against the sternum as well resulting in a decrease in the retrosternal air space. On the lateral, the cardiac shadow takes up more than 1/2 of the diaphragm. In this uncommon instance this finding is caused by the enlarged right atrium rather than LVE
Ashley Davidoff MD
Next
Davidoff with Notes Scales and Music of the Axial Imaging of the Heart
NOTES SCALES AND MUSIC – AXIAL IMAGING OF THE HEART
Notes
As we scan from superior to inferior
-
NOTES OF THE HEART ON CT
As we start from top to bottom we scan through the PA, aorta, then LA RA, RV and LV
Ashley Davidoff MD
Scales
Going superior to inferior and clockwise
1st stop Aorta LA
-
-
-
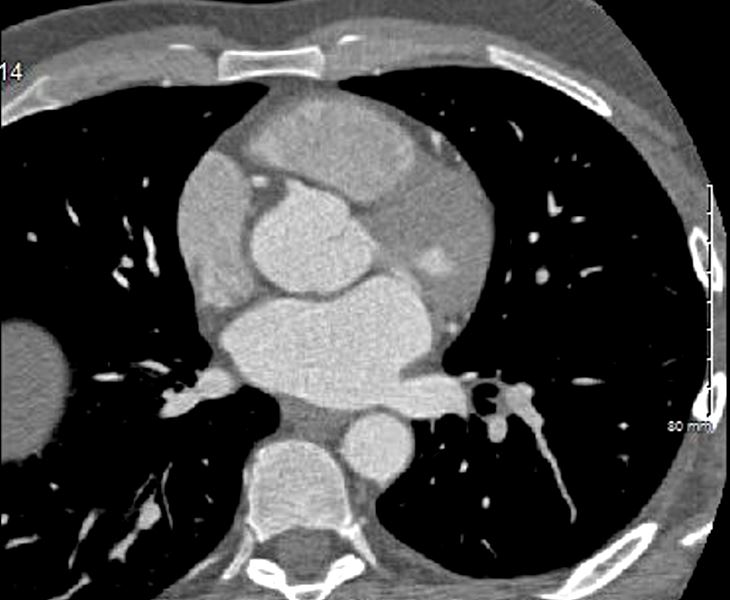
FIRST STOP
Max AP dimension of the LA in the region of the aorta. At this point the LA looks rectangular
Ashley Davidoff MD
-
-
2nd Stop
4 chamber
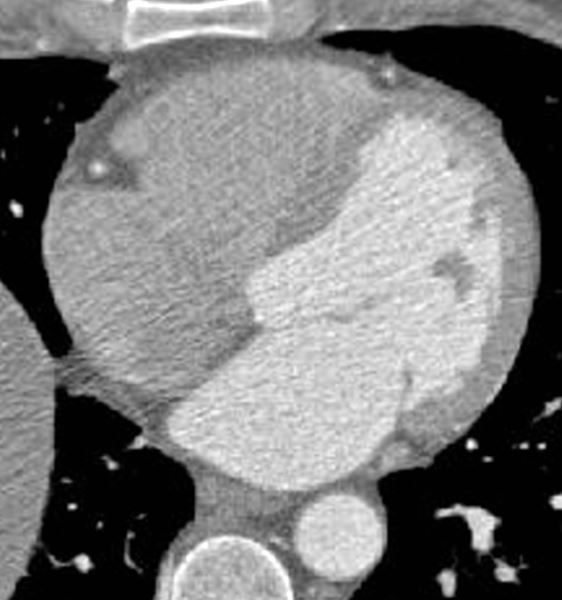
Axial images through the 4 chambers at the level of the A-V valves during diastole (mitral valve open) enables an approximate volume evaluation of the chambers. The atria are approximately the same volumes, and are about 1/3 the volume of the ventricles. The right ventricle (RV) is about 2/3 the volume of the left ventricle (LV)
Ashley Davidoff MD
3rd Stop MPA and Bifurcation
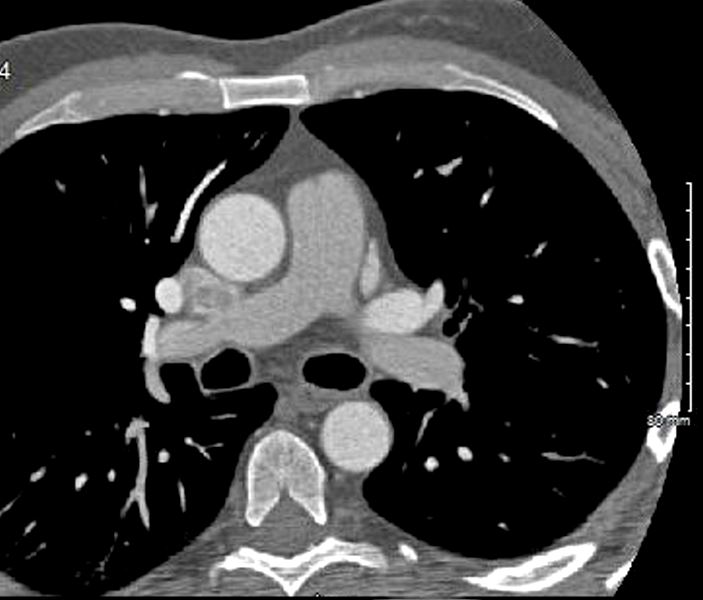
MPA – Aorta
Ashley Davidoff MD
What to do at each stop
Stop 1
Stop 2
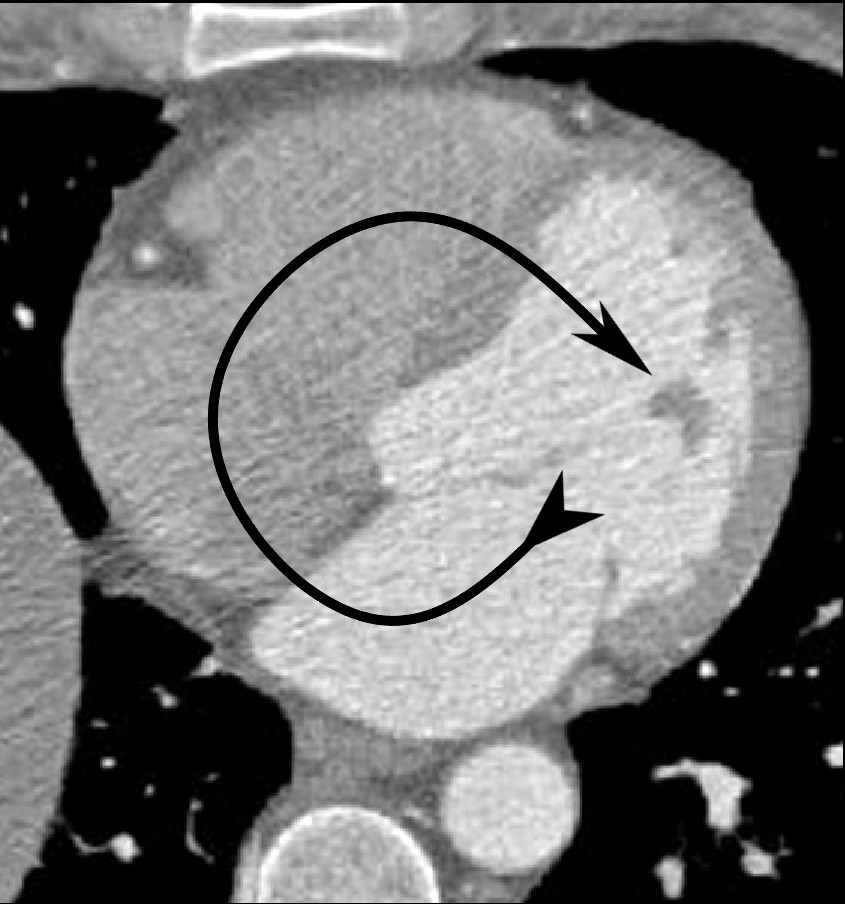
Clockwise Rotation
Axial images through the body of the right atrium (RA) at the level of the tricuspid valve shows a linear dimension of 4.2cms (normal up to about 5cms)
Ashley Davidoff MD
Get a Sense of Relative Volumes
3rd Stop PA and Aorta

Practice Practice Practice
- Music
- LAE
- RAE
- RVE
- RV dilated
- RVH
- LVE
- Dilated LV
- LVH
Thus
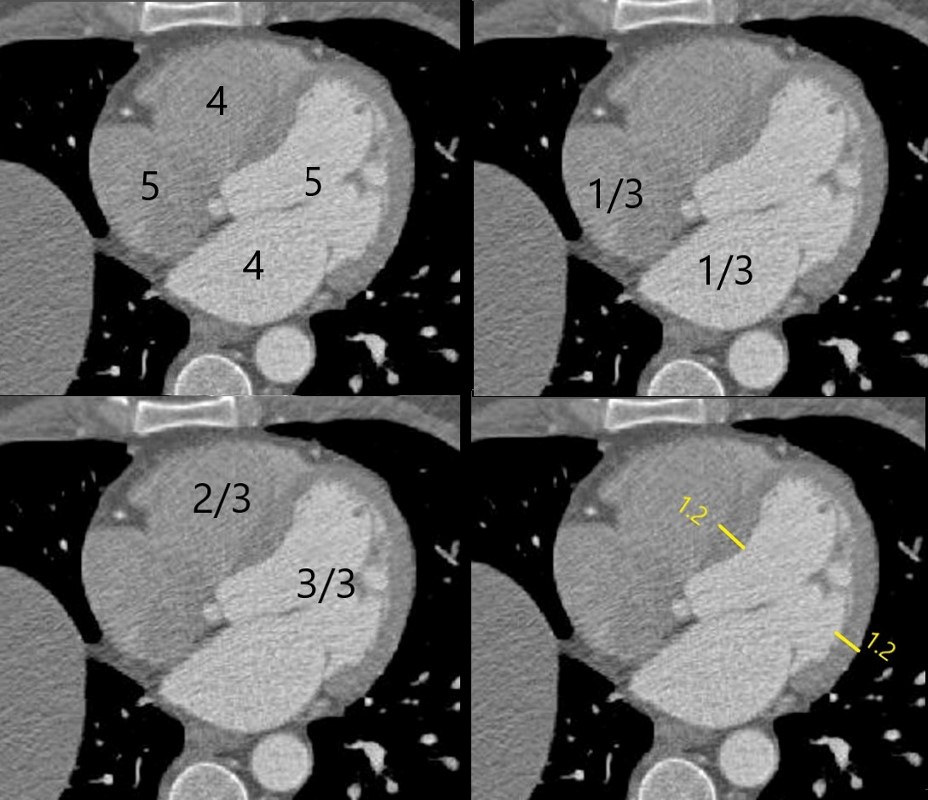
- First Image
- top left image
- sizes to remember (approximate +/- 1cms) Mantra 4,5,4,5
- top right image –
- at the level of the mitral valve the atria are about the same size and about 1/3 the size of their respective ventricles
- bottom left
- at this level the overall volume of the RV is about 2/3 the size of the LV
- bottom right
- In diastole (if you can appreciate open mitral valve) thickness is up to 1.2 cms – 1.4 is upper limits normal
- top left image
- Next series of images – as you start from the top of the heart on the axial image and follow the order so you can remember mantra (4,5,4,5 – of the approx sizes of the structures)
- Where to measure LA –
- Look for the aorta – and then look up and down till you find max dimension
- Where to measure RA
- See where the approx position of TV and the from posterior wall to the TV
- Where to measure RV and LV cavity dimensions
- – at at the level of the A-V valves or mid septum by the moderator band
- LV wall thickness
- Same level
- Overall Volume Assessment
- At the same level Rule of thirds for volume
- MPA and Ao
- At bifurcation of MPA
- Systole and diastole to look assess EF
- On gated images – compare peak systole to diastole using eyeball and mitral or tricuspid valve and use rule of thirds
- Where to measure LA –
Summary
 NOTES SCALES AND MUSIC
At the level of the mitral valve which is also about mid septum, the chambers are relatively all best visualised. This is a place where approximate size can be evaluated
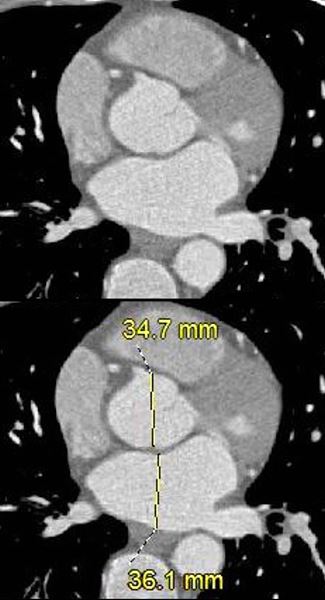
LA +/- 4cms (post wall to MV)
The aorta is a reference structure and is usually about the same size or smaller. In this instance it is 3.5cms.
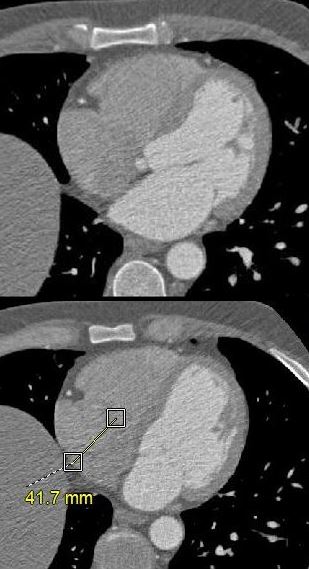
RA +/- 5cms (post wall to TV)
(normal up to about 5cms)
RV +/- 4cms (transverse) not >6
NORMAL LINEAR DIMENSION OF THE RIGHT VENTRICULAR CAVITY ON A GATED CT SCAN
(normal up to about 4-5cms)
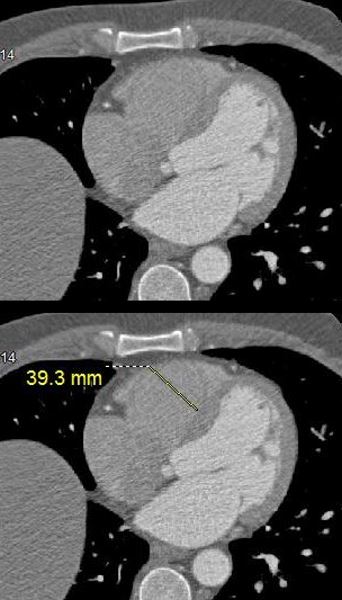
LV +/- 5cms (transverse) not >6
NORMAL LINEAR DIMENSION OF THE LEFT VENTRICULAR CAVITY ON A GATED CT SCAN
(normal up to about 5-5.5cms)
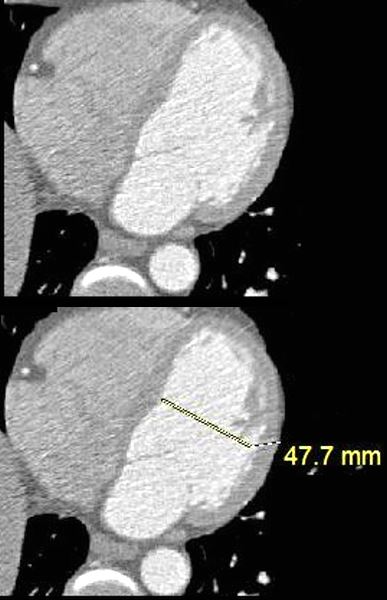
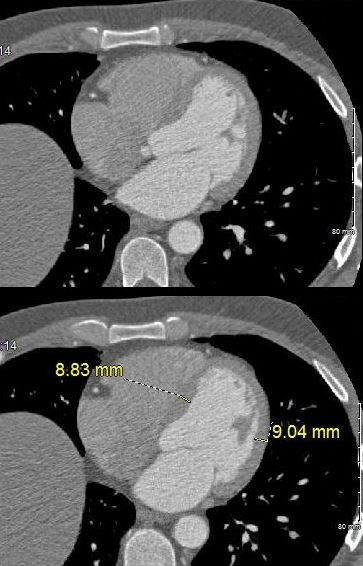
LV Thickness in Mid Septal Region
Buzz
1.2
Axial images through the left ventricle (LV) in mid septal region at the level of the opened mitral valve (early diastole) shows a septal thickness of 8.8mms and free wall thickness of 9mms (normal up to about 12mms)
Ashley Davidoff MD
Volume Assessment of the Cavities (Rule of Thirds)
Buzz
RA = LA = 1/3 ventricles
RV = 2/3 LV
Axial images through the 4 chambers at the level of the A-V valves during diastole (mitral valve open) enables an approximate volume evaluation of the chambers. The atria are approximately the same volumes, and are about 1/3 the volume of the ventricles. The right ventricle (RV) is about 2/3 the volume of the left ventricle (LV)
Ashley Davidoff MD
PA/Ao
Buzz
3/3.5
Axial images through the main pulmonary artery (MPA) and proximal ascending aorta (Ao) shows a MPA measurement of 2.5cms (normal up to 3cms) and referenced to the aorta usually about the same size or
Ashley Davidoff MD
Volumes in Systole and Diastole

19 year old male with syncope with normal MRI.
Images a and b show peak systole with volumes of the LV and RV about 1/3 the volume of their respective ventricles when in diastole. This leaves 2/3 of volume has been ejected implying that the ejection fraction is 66%
Ashley Davidoff MD
Summary
At the level of the mitral valve which is also about mid septum, the chambers are relatively all best visualised. This is a place where approximate size can be evaluated
Ashley Davidoff MD
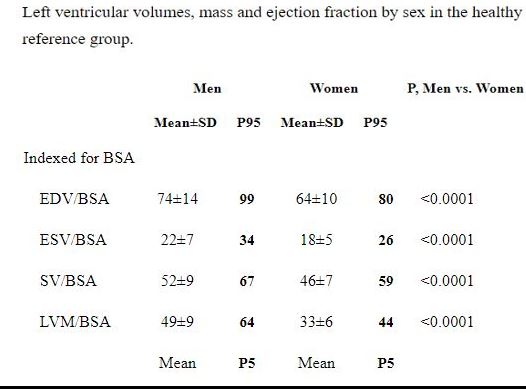
LV Mass and LV Mass Index
Left ventricular mass and left ventricular mass indexed to body surface area estimated by LV cavity dimension and wall thickness at end-diastole.
Method
- Evaluation on short axis parallel to the true LV short axis
- LV mass is measured at a single time point within the cardiac cycle (the standard is end-diastole)
- single breath-hold removes respiratory artifact.
- About 10 slices will cover the ventricle,
- Simpson’s method (“stack of disks”)
- calculated from the
- product of the myocardial volume
- difference between the epicardial and endocardial LV volumes by a semi-three dimensional data set
- specific gravity of heart muscle (1.05 g/ml).
- product of the myocardial volume
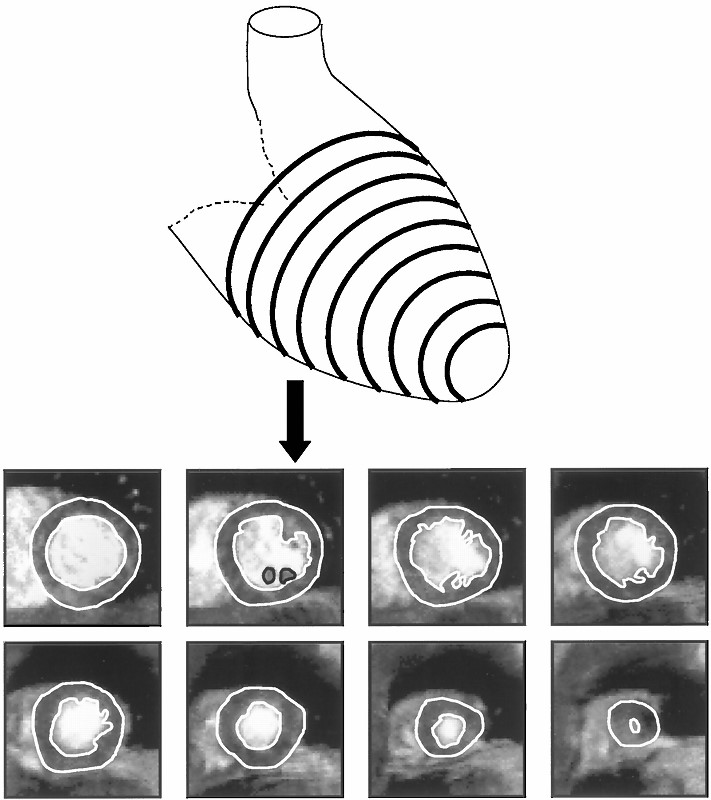
Diagrammatic representation of the LV with typical CMR short axis images obtained.
Myerson,S et al Assessment of Left Ventricular Mass by Cardiovascular Magnetic Resonance
Hypertension Vol. 39, No. 3 2002
Normal Values have such a wide range depending on sex age and race – Echo and MR measurement are fairly consistent
Females about 60 g/m2
Males about 70 g/m2
References and Links
LV mass was significantly higher in males compared to females (mean ± SD of 53 ± 9 g/m2 vs 42 ± 7 g/m2). Petersen et al JCMR
Normal values of LV mass indexed to body surface area were found to be 70 (+/- 6-9 g/m2 in men and 61 (+/- 6 -8 g/m2 in women. Mizukoshi, showed echo and MR good correlation
Normal values of LV mass indexed to body surface area were found to be 60 (+/- 9 g/m2 in men and 49 (+/- 7 g/m2 in women). Fuchs EHJ CV Imaging
Reference Ranges & Partition Values for LV Mass Indexed To BSA (g/m2)
| Female | Male | |
| Reference Range | 43-95 | 49-115 |
| Mildly Abnormal | 96-108 | 116-131 |
| Moderately Abnormal | 109-121 | 132-148 |
| Severely Abnormal | ≥122 | ≥149 |
Mizukoshi, Left ventricular mass quantitation using single-phase cardiac magnetic resonance imaging. Am J Cardiol. 1992 Jul 15;70(2):259-62.
Mizukoshi, MD, et al CLINICAL INVESTIGATIONS
LEFT VENTRICULAR MASS AND FUNCTION
Normal Values of Left Ventricular Mass Index Assessed
by Transthoracic Three-Dimensional
Echocardiography
Our Patient
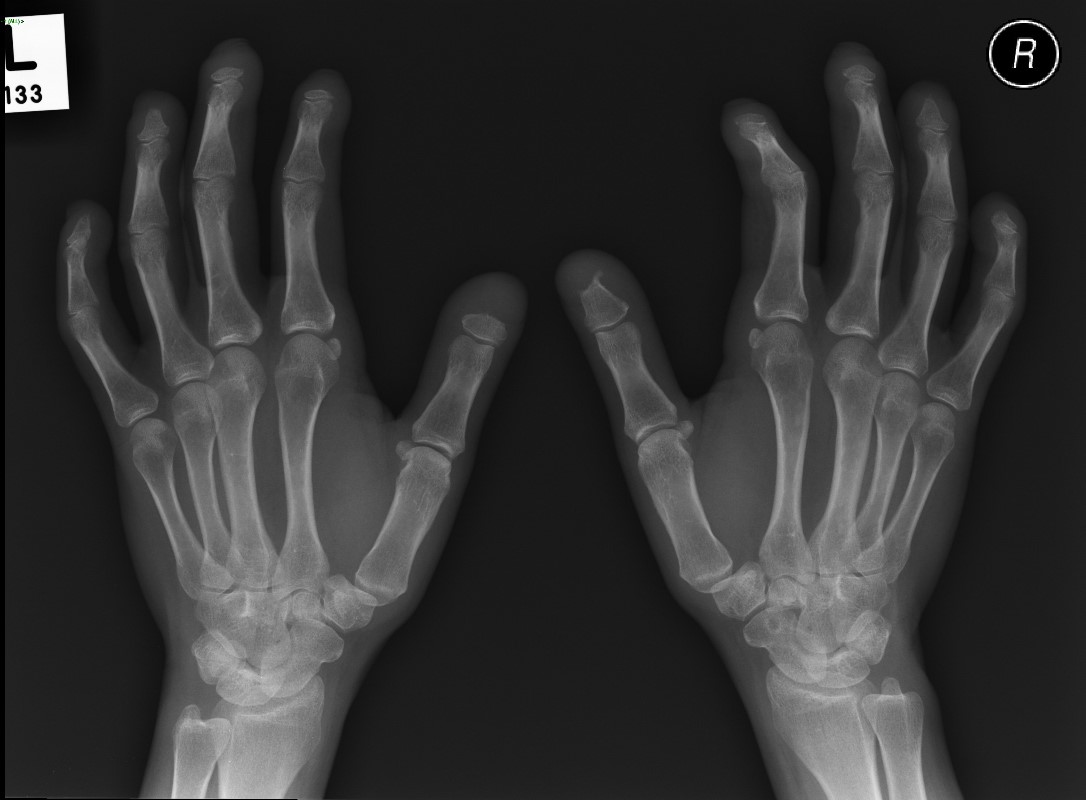
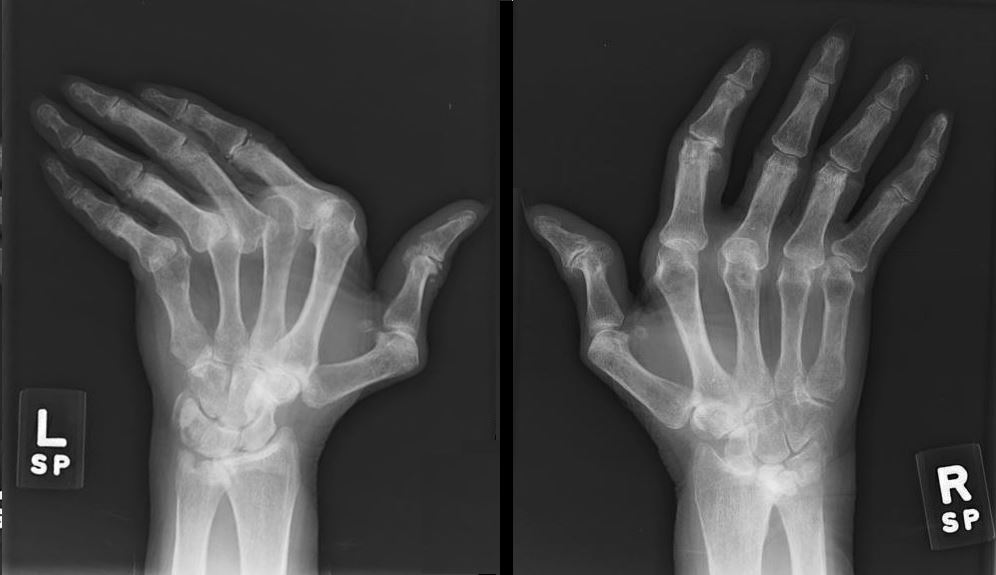
65 year old female with longstanding history of SLE, Lupus Sjogren’s and Raynaud’s

65 year old female with longstanding history of SLE, Lupus Sjogren’s and Raynaud’s Xray shows non erosive arthropathy with ulnar deviation of 2nd through 5th MCP joints
SLE
Heart
- Pancarditis
- pericardium, pericarditis 25% most common
- myocardium, myocarditis is rare and caused by vasculitis
- endocardium – Libman-Sacks 10% mitral and tricuspid valve
- myocardial infarction 9X increase
- Cardiac complications in about 50% and major cause of death
Scleroderma
-
Heart
-
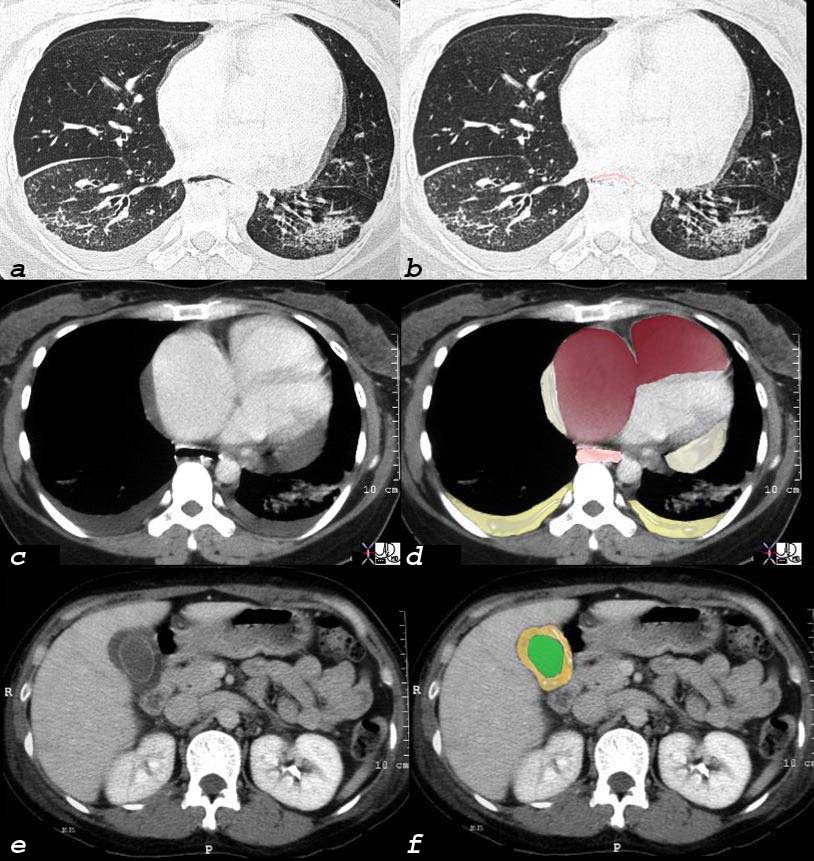
Scleroderma, Pulmonary Hypertension RVF Cor Pulmonale Pericardial effusion
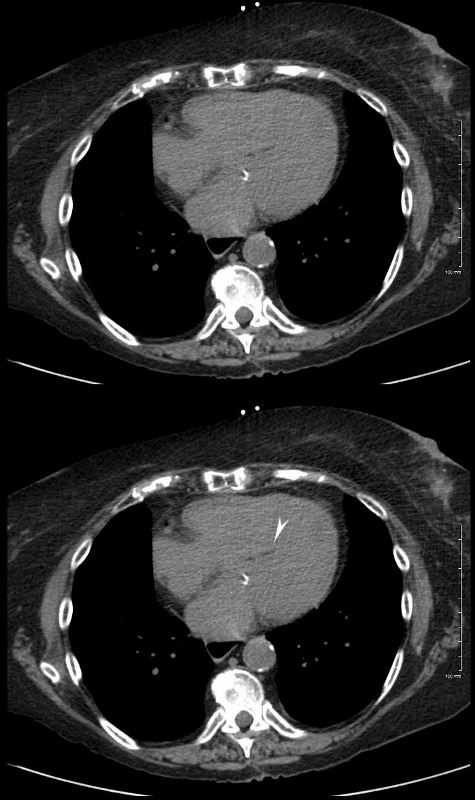
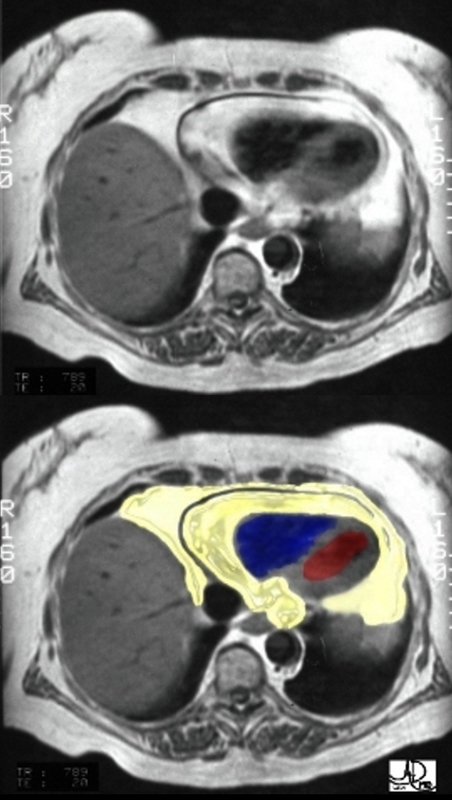
40 year old female with known interstitial lung disease (a and b) shows enlarged right atrium and right ventricle and small pericardial effusion (c and overlaid in maroon in d) and enlarged esophagus (overlay in pink in d) and an edematous gallbladder wall from chronic right heart failure.
Hands
Soft Tissue Calcification Ulnar Deviation
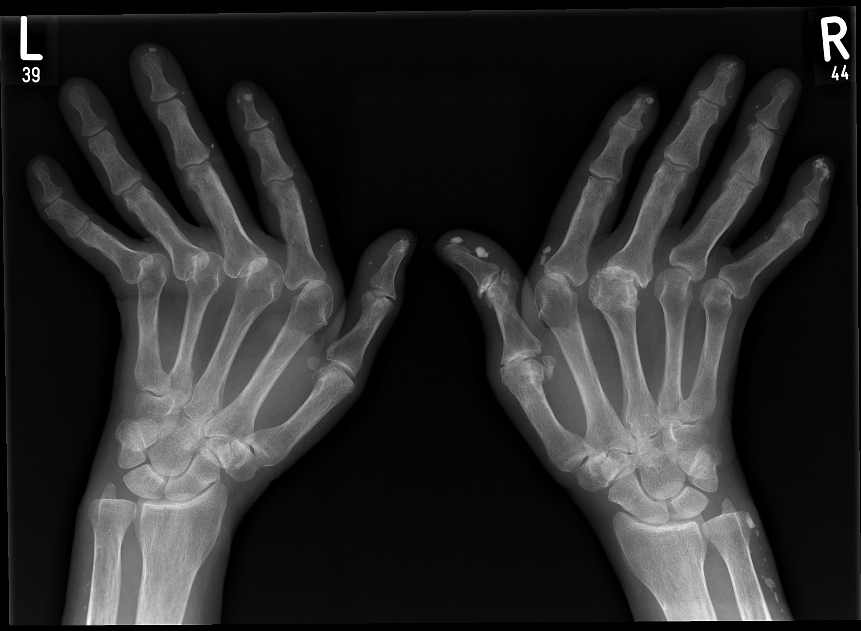
Radiographs of both hands show abnormal alignment of the metacarpophalangeal joints, most marked on the left, in keeping with subluxation. The bone density appears normal. There is joint space loss and evidence of erosive arthropathy particularly evident at the metacarpophalangeal joinft of the right 3rd and 4th MCP’s. Dense soft tissue calcifications are seen in the fingertips and along the ulnar aspect of the right wrist/distal forearm.
Case courtesy of Dr Jan Frank Gerstenmaier,
Radiopaedia.org, rID: 23125
Acroosteolysis
Acroosteolysis in a female patient with scleroderma
Case courtesy of Dr Minh Xuan Truong,
Radiopaedia
TCV –Scleroderma and the Heart
Rheumatoid Arthritis
Heart
- Increased incidence of
- congestive heart failure and
- ischemic heart disease associated with an
- increased mortality
- Pancarditis
Hands
Erosive Osteoarthritis dominant in the MCPs and Carpals
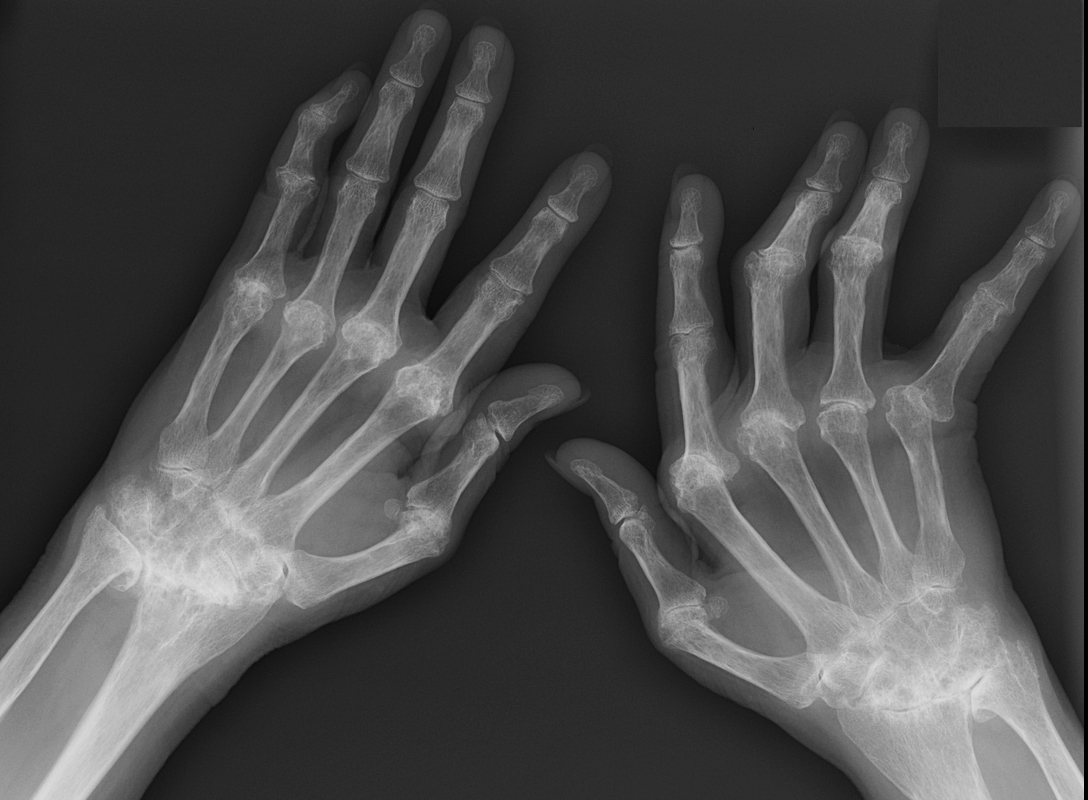
Showing degenerative and erosive changes dominantly at the MCP joints, intercarpal joints, ulnar carpal and radiocarpal joints and to lesser extent the PIP joints. There is ulnar deviation more prominent on the right hand
Ashley Davidoff MD
Rheumatoid Arthritis and Heart Disease TCV
RA and the Hand TCV
For more extensive info in see TCV on Hands and Heart
? Cardiomegaly ? CHF
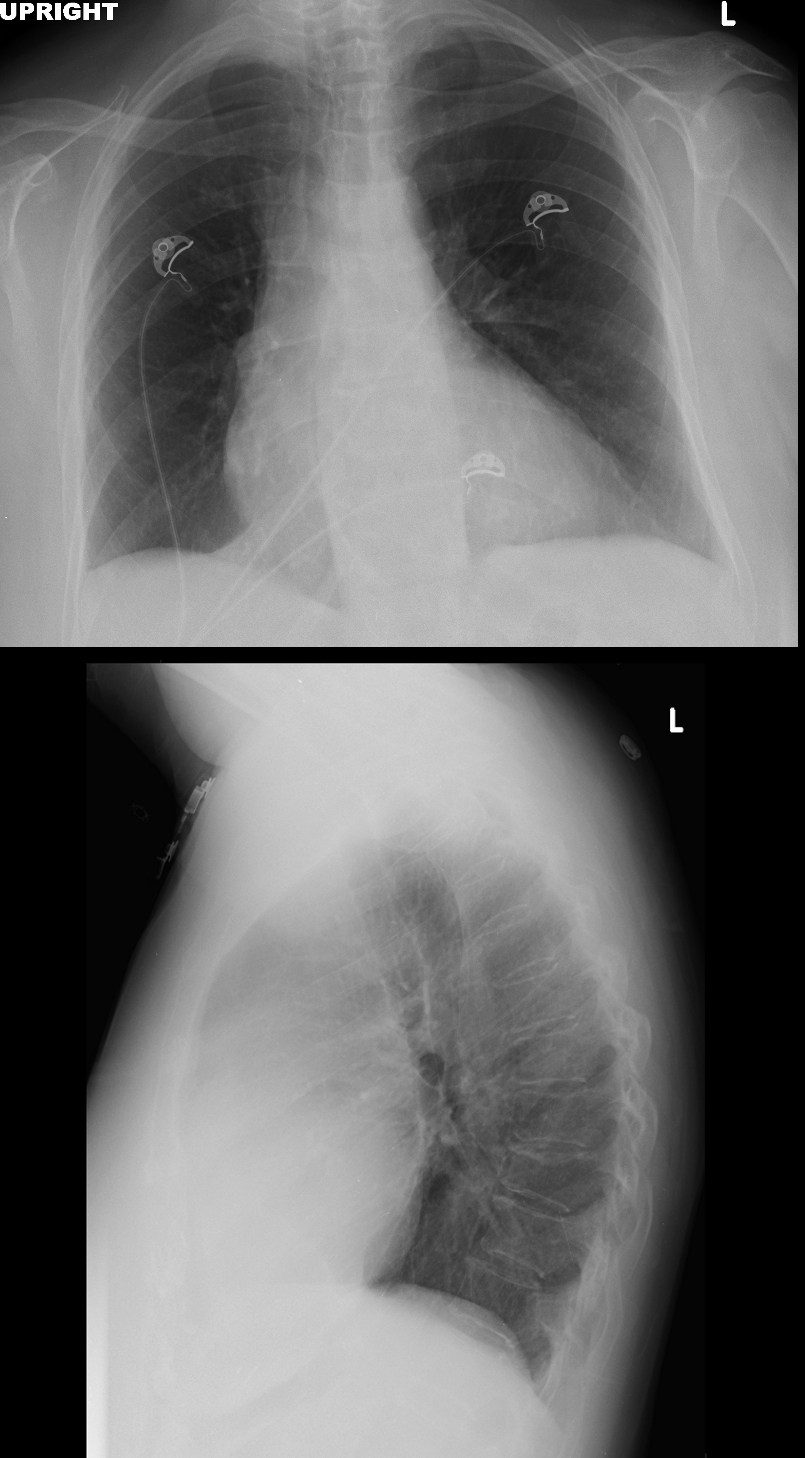 CARDIOMEGALY – LVE RVE
Chest Xray of a 65 year old female with longstanding history of SLE, Lupus Sjogren’s and Raynaud’s presented with 2 weeks of dyspnea and elevated troponins suggestive of a STEMI.
Places to review
Cardiothoracic ratio
Shape of the Heart (ovoid or triangle)
Carinal angle for LA enlargement
Equalisation cephalisation, interstitial edema

Chest X-ray of a 65-year-old female with longstanding history of SLE, Lupus Sjogren’s and Raynaud’s presented with 2 weeks of dyspnea and elevated troponins suggestive of a STEMI. CXR on the frontal view shows a CT ratio that is probably normal, equivocal carinal angle and no evidence of CHF. Lateral exam suggests RVE with RV : sternal ration being >30% and LV: diaphragm ratio being >33%
Ashley Davidoff MD
Answer
Probable LVE and RVE
Unusual PA not enlarged and LA not enlarged
Mitral Annular Calcification
- Degenerative process associated with
- aging,
- cardiovascular risk factors.
- Degeneration from increased mitral valve stress
- Aortic Stenosis
- Hypertension
- Hypertrophic Cardiomyopathy
- Also seen in
- chronic kidney disease, (Ca PO4 disorder)
- following radiation therapy.
- Associated with
- arrhythmias and heart blocks
- MS and MR are rare
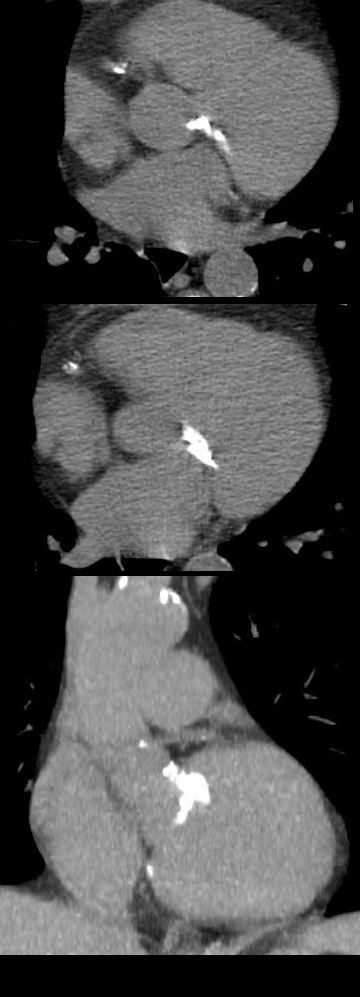
Our Case
Mitral Annulus and Aortic Annulus Calcification
Other Examples
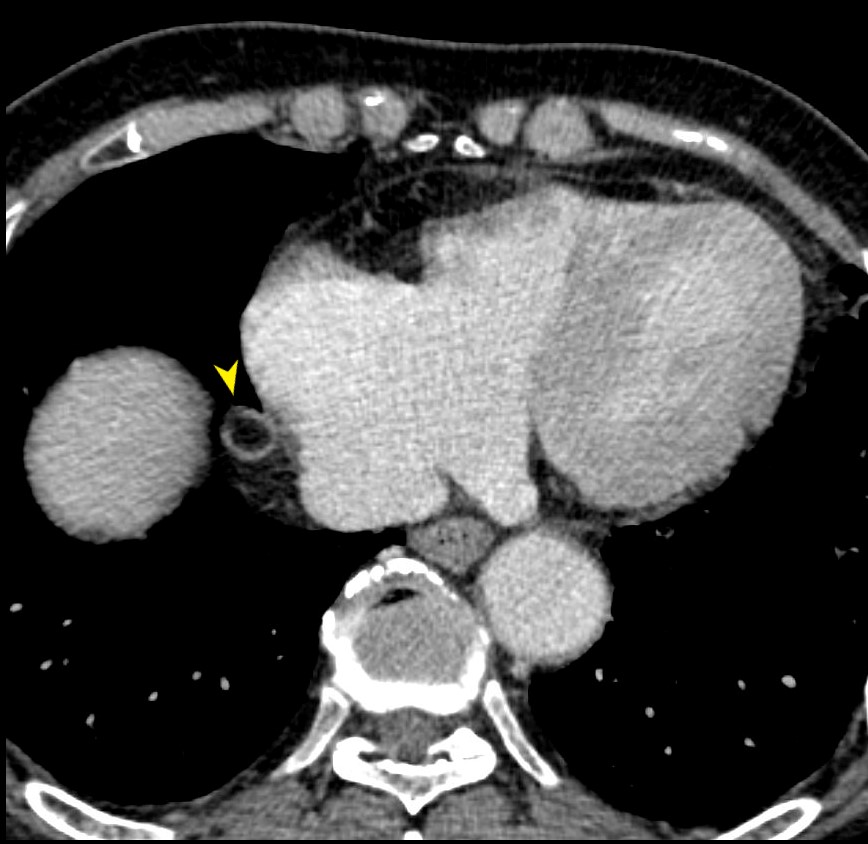
MAC and IHD
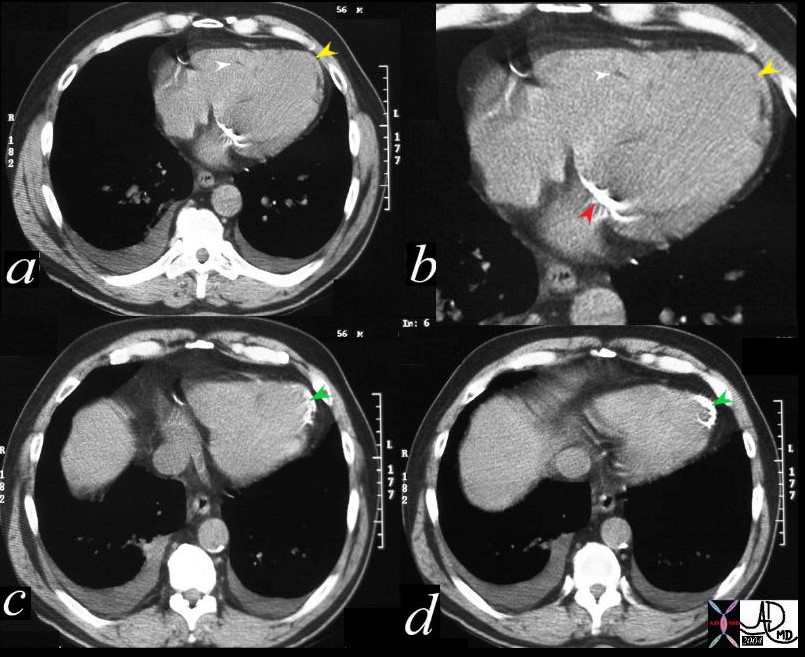
56 year old male with history of coronary artery disease. Axial CT through the heart shows apical curvilinear fat (yellow arrowheads, ( a and b) associated with apical myocardial dystrophic calcification (green arrowheads c and d) both indicating prior apical MI. In addition there mitral annular calcification (red arrowhead, b) and multifocal fatty deposits in the RV (white arrowheads, a and b) usually depicting age related degenerative changes. The calcification in the annulus is premature and unusual for this 56 year old male patient. Note the small bilateral pleural effusion The association of atherosclerosis and MAC are well known. Premature MAC should therefore be a warning for premature heart disease.
Ashley Davidoff MD
Examples of Uncommon Complications
Heart Block, MR and MS
SEVERE MITRAL ANNULAR CALCIFICATION
Axial CT through the mitral annulus shows severe mitral annular calcification extending into the ventricular cavity and the ventricular septum.
MAC and Caseous Necrosis
 MAC and CASEOUS NECROSIS
69 year old female with MAC who presents with an echo finding of a mass on the mitral valve thought to represent a myxoma. CT confirmed a low-density mass measuring in the soft tissue range associated with mitral annular calcification.
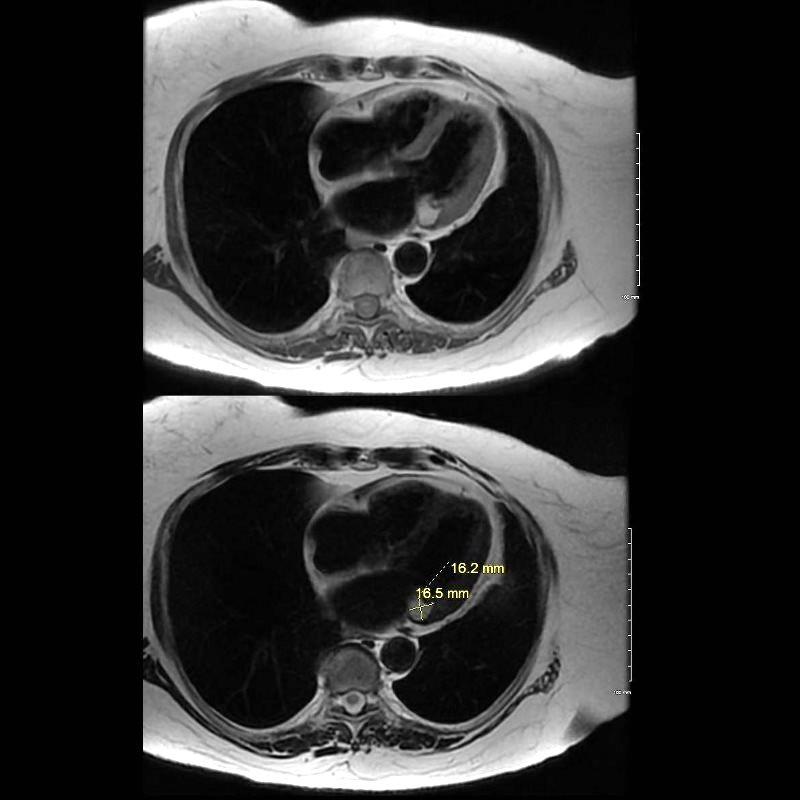
. MRI showed a mass in the region of the posterior leaflet of the MV with T2 hyperintensity suggesting aqueous component and T1 hyperintensity suggesting increased protein content. There was no enhancement of the lesion. Peripheral T1 and T2 low intensity reflects calcification. A diagnosis of caseous necrosis of MAC is most likely
MRI showed a mass in the region of the posterior leaflet of the MV with T2 hyperintensity suggesting aqueous component (upper image) and focal T1 low intensity nodule on the posterior leaflet reflects the MAC There was no enhancement of the lesion. A diagnosis of caseous necrosis of MAC is most likely
MAC Dextrocardia and Bacterial Endocarditis
 DEXTROCARDIA, MAC and BACTERIAL ENDOCARDITIS
Links and References
Abramovitz Y et al Mitral Annulus Calcification. J Am Coll Cardiol 2015;66:1934-1941. (excellent review)
Allison M, et al Mitral and Aortic Annular Calcification Are Highly Associated With Systemic Calcified Atherosclerosis Circulation Vol. 113, No. 6
- The points I want to try and get across
- How to diagnose constrictive pericarditis on CT
- Questions and Answers
-
- What are the signs of constrictive pericarditis on CT
- pericardial thickening
- diffuse or localized(2mm – 3mm equivocal)
- signs of impaired diastolic filling of the right ventricle
- ie signs of right heart failure including
- dilatation of the
- RA
- IVC and hepatic veins
- Coronary Sinus
- Azygos vein
- Hepatomegaly
- dilatation of the
- What is the role of the CXR and LA in Dx
- increase in left atrial because it cannot fill therefore
- increase in pulmonary venous pressure
- Usually normal size LA
- However since LA hmay be only partly covered by pericardium, it may in fact enlar
- pericardial thickening
- What are the signs of constrictive pericarditis on CT
-
- Questions and Answers
-
In our patient there is
- no pericardial thickening
- minor pericardial calcification
- There are
-
- focal adhesions near the LAD
-
Are There Signs of Constriction?
Consider
Pericardium Thickness
Size of the Right Atrium
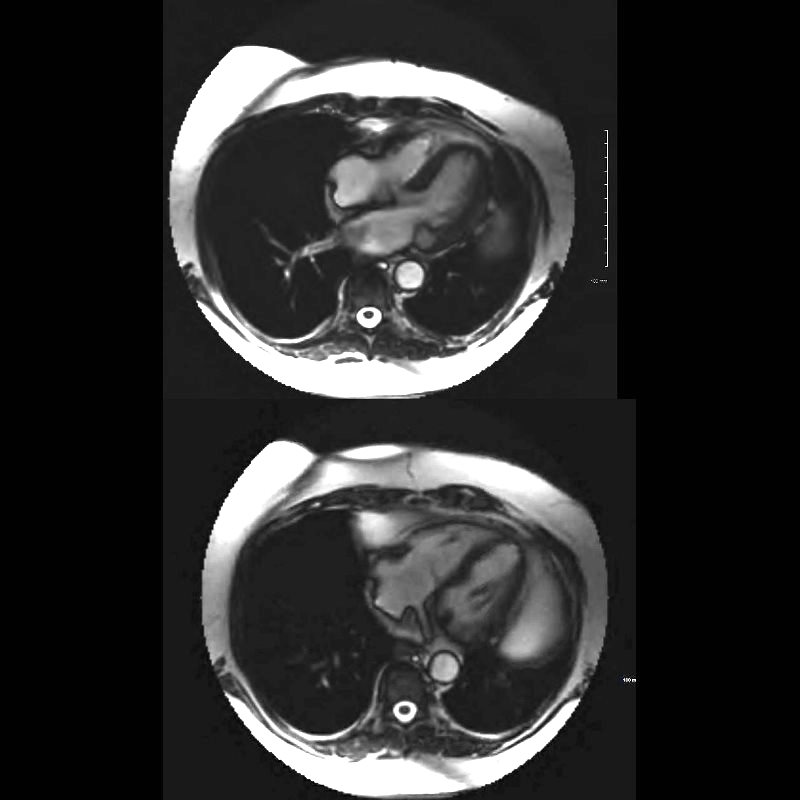
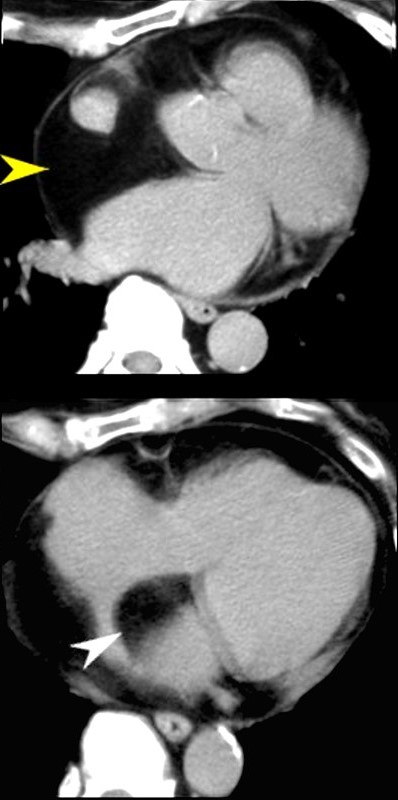
The axial image through the region of the AV valves shows normal sized atria. Constriction would be unlikely in the face of a normal sized right atrium. Note the flattened surface of the right atrium
Ashley Davidoff MD
? Size of the Coronary Sinus
The axial image through the region of the normal sized coronary sinus. Constriction would be unlikely in the face of a normal sized coronary sinus. Note the flattened surface of the right atrium.
Ashley Davidoff MD
? Size of the Azygos Vein and IVC

The axial image is through the region of the normal azygos vein (above) and the normal sized IVC (below). Constrictive pericarditis would be unlikely in the face of a normal sized azygos vein and IVC.
Thus constrictive pericarditis is not present
ABR
Links and References
Napolitano G et al Imaging Features of Constrictive Pericarditis: Beyond Pericardial Thickening Canadian Association of Radiologists Journal Volume 60, Issue 1, February 2009, (good review)
Senapati A et al, Disparity in spatial distribution of pericardial calcifications in constrictive pericarditis Openheart BMJmj. Volume 5, Issue 2
Khalid, N et al Pericardial Calcification StatPearls
- First our patient
- subtle linear fat accumulation in the septum in this patient with CAD
- Second
- show examples of fat in the heart
There are a lot of cases – Do not feel the need to complete in 3 minutes
Clinical summary of a 65 year old female with longstanding history of SLE, Lupus Sjogren’s and Raynaud’s presented with 2 weeks of dyspnea and elevated troponins suggestive of a STEMI. Cardiac cath showed 2 vessel disease and she was referred for CABG. At surgery there were adhesions and the surgeon was unable to identify the coronaries as a result of the fibrosis. She was closed without surgery. She subsequently had a diagnostic MRI and endomyocardial biopsy which showed chloroquine related cardiomyopathy
Ashley Davidoff MD
Normal and Normal Variants
Epicardial and Pericardial Fat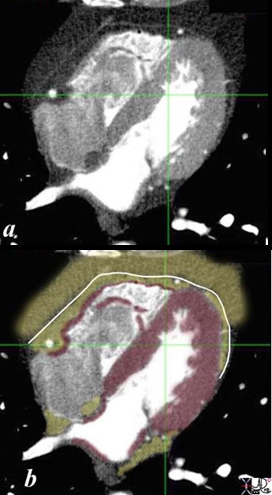
THE PERICARDIUM , EPICARDIAL FAT AND PERICARDIAL FAT CT scan through the 4 chambers shows a normal pericardium (white line) surrounded by an inner lining of epicardial fat (yellow in contact with the red myocardium ) and an outer layer of pericardial fat) . Note that the coronary arteries (white dots run in the epicardial fat. Ashley Davidoff MD heart anatomy P 08
Large Amount of Epicardial and Pericardial Fat associated with
-
- increased cardiovascular risk, especially for coronary artery disease. – Metabolic Syndrome
An axial T1 weighted MRI shows a large amount of fat (yellow overlay) around the heart. The epicardial fat is the inner layer and is intimately related to the heart and the pericardial fat is the outer layer. The normal pericardium is seen as a black line between the two layers of fat. Although the pericardium looks like a single layer, it actually consists of two structures – the epicardial serous component and the pericaricardial fibrous component. In pericardial effusion the two layers are separated.
The amount of fat is more than expected and this amount is often associated with Syndrome X.
Courtesy of Ashley Davidoff M.D. 32141.8 code normal heart epicardial fat pericardium anatomy cardiac imaging radiology MRI
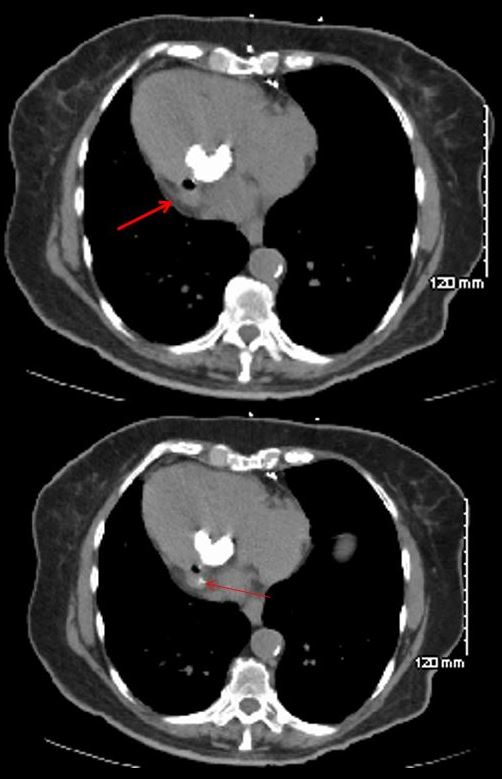
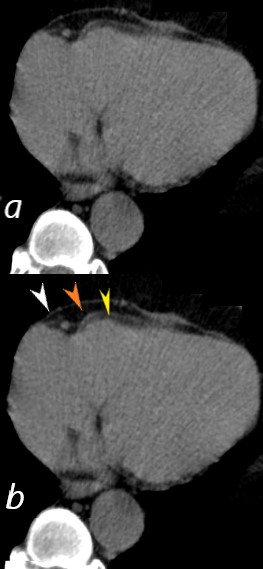
Epicardial Fat with Mild Pressure Effect on the RV
CT scan through the RV and LV shows epicardial fatty accumulation in the subendocardium of the right ventricle. The normal pericardium, (white arrowhead) and normal epicardial fat (yellow arrowhead) are shown in the lower images.
Ashley Davidoff MD
130641L
Degenerative and Age Related Changes in the RV
Axial, non contrast CT scan of a 100 year old female showing physiological accumulations of fat in the right ventricle (RV) and likely in the papillary muscles of the left ventricle (LV)
Ashley Davidoff MD
In the RV Wall
Ashley Davidoff MD
130639L
Atrial Septal Lipoma and Large Amount of Pericardial Fat Patient on Steroids
Axial CT scan through the heart is from a 71year old female who is on steroid therapy. A large amount of fat is noted in the epicardium (yellow arrowhead) and also in the interatrial septum resulting in an atrial lipoma.
In CAD and prior Myocardial Infarction
56 year old male with history of coronary artery disease. Axial CT through the heart shows apical curvilinear fat (yellow arrowheads, ( a and b) associated with apical myocardial dystrophic calcification (green arrowheads c and d) both indicating prior apical MI. In addition there mitral annular calcification (red arrowhead, b) and multifocal fatty deposits in the RV (white arrowheads, a and b) usually depicting age related degenerative changes,
Ashley Davidoff MD
Unusual cases
Pericardial Lipoma
LIPOMA OF THE PERICARDIUM
CXR shows widening of the left main bronchus and a vague lucency at the apex of the heart, CT shows lipoma posterior to the LA
Lipoma at the SVC RA junction
This image of a coronally acquired T1 weighted MRI image of the heart shows a high intensity mass surrounding the SVC and the entrance right atrium (RA) with narrowing of the SVC. There were no symptoms of SVC syndrome in this patient with known COPD. Note that the mass has the intensity of subcutaneous fat. An atrial lipoma is the most likely diagnosis.
Courtesy Jorge Medina
38449c
KEY WORDS
Cardiac, heart, vein, SVC , RA, mass, fat, lipoma, tumor, neoplasm, benign, imaging, radiology, MRI
This series of axial T1 weighted MRI images of the heart show a high intensity mass surrounding the SVC (blue arrowhead) and the entrance to the right atrium (RA). There were no symptoms of SVC syndrome in this patient with known COPD. Note that the mass has the intensity of subcutaneous fat. An atrial lipoma is the most likely diagnosis.
Courtesy Jorge Medina
This series of axial and coronal T1 weighted MRI images of the heart show a high intensity mass surrounding the SVC and the entrance to the right atrium. There were no symptoms of SVC syndrome in this patient with known COPD. Note that the mass has the intensity of the subcutaneous fat. An atrial lipoma is the most likely diagnosis.
Courtesy Jorge Medina
38449c
KEY WORDS
Cardiac, heart, vein, SVC , RA, mass, fat, lipoma, tumor, neoplasm, benign, imaging, radiology, MRI
FAT NECROSIS-Target shaped
EPICARDIAL FAT NECROSIS
79-year male with asymptomatic finding on axial CT of a focal sclerotic ring surround the epicardial fat on the right side of the heart (yellow arrowhead). This most likely reflects chronic epicardial fat necrosis
Ashley Davidoff MD
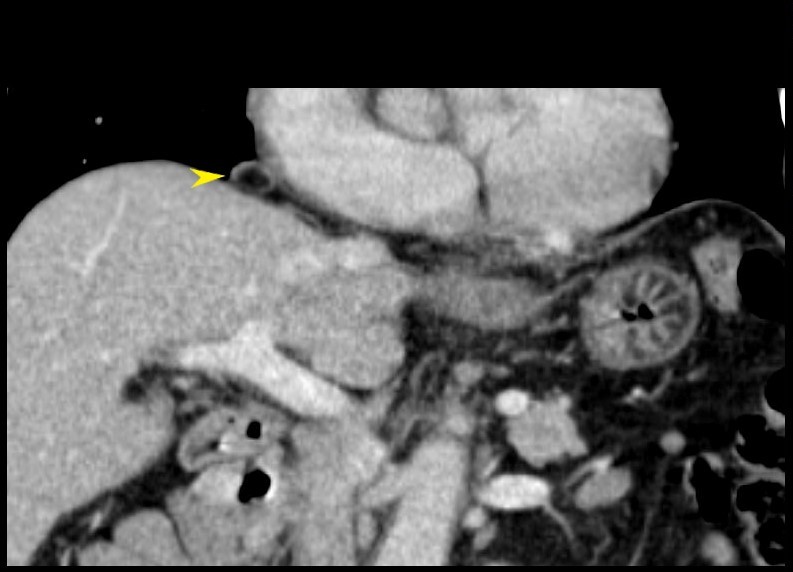
79-year male with asymptomatic finding on coronally reformatted CT of a focal sclerotic ring surround the epicardial fat on the right side of the heart (yellow arrowhead). This most likely reflects chronic epicardial fat necrosis
Ashley Davidoff MD
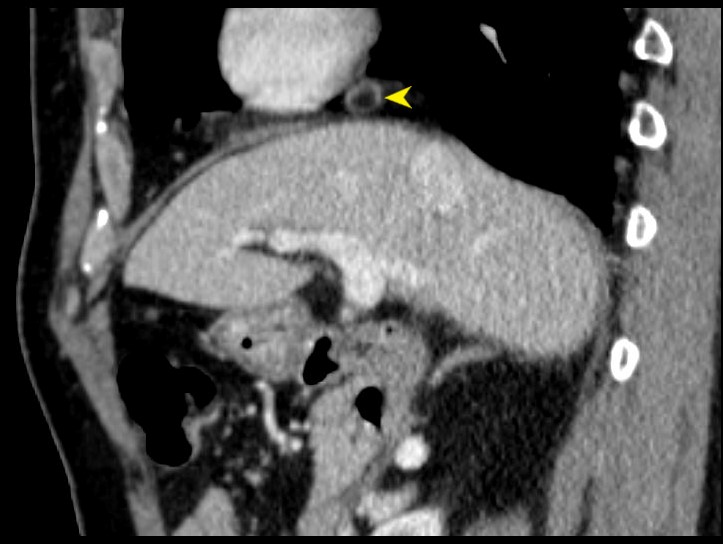
79-year male with asymptomatic finding on sagittally reformatted CT of a focal sclerotic ring surround the epicardial fat on the right side of the heart (yellow arrowhead). This most likely reflects chronic epicardial fat necrosis
Ashley Davidoff MD
Lipoma of the LV
37 year old male with no history of CAD with a fat containing nodule at the LV apex most likely representing a lipoma of the myocardium
Ashley Davidoff MD
Kimura et al Myocardial Fat at Cardiac Imaging: How Can We Differentiate Pathologic from Physiologic Fatty Infiltration? RadioGraphicsVol. 30, No. 6
We should distinguish pathologically between biventricular infiltration and hypertrophy
Biventricular hypertrophy is really rare event
Biventricular thickening /infiltration is also uncommon but should be what we think about when both ventricles are thick
- So first question to address
- Normal thickness of LV in diastole (number to remember is 1.2 but upper limits 1.4cms)
- Normal thickness of RV in diastole (hard to measure but 3-5mms)
- next question
- What are the infiltrative cardiomyopathies that can cause biventricular infiltration
- Most important to remember are
- amyloidosis
- sarcoidosis
- Less commonly
- Hemochromatosis
- Fabry disease,
- Danon disease, and
- Friedreich’s ataxia.
- How do they affect function
- primarily affect diastolic function and
- less commonly systolic function
Examples of Biventricular Thickening/Infiltration?
Our case with SLE, Sjogrens Raynauds
Two other more common causes of biventricular infiltration and thickening
-
- Amyloidosis of the heart
- Sarcoidosis of the heart
Left Ventricular Septal and Free Wall Thickening Atrial Septal Thickening
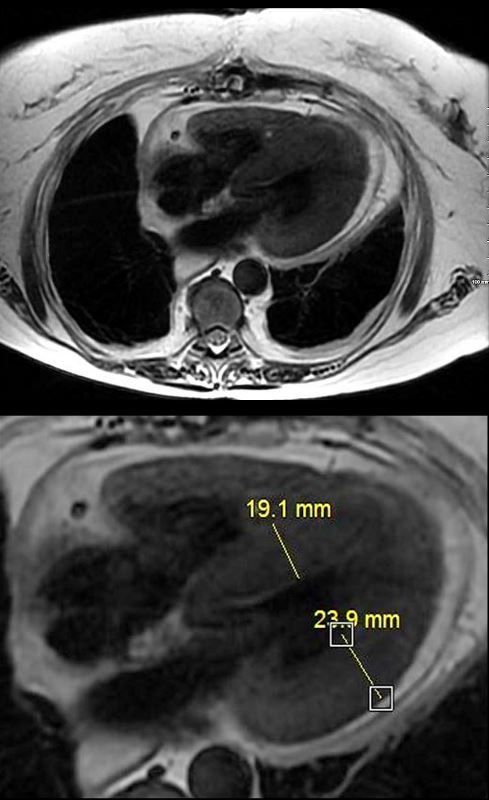
 CARDIAC AMYLOIDOSIS with LV THICKENING – INFILTRATION VS LVH
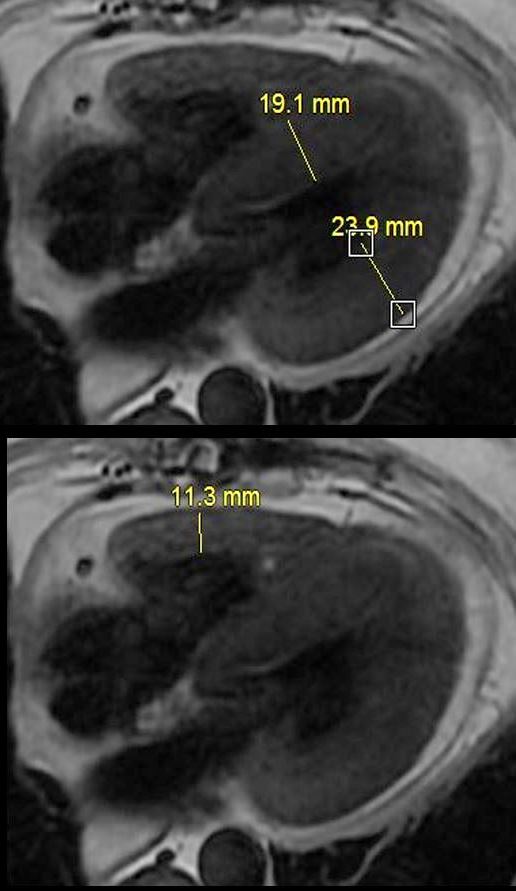
Non gated axial CT through the opening of the mitral valve suggests early diastole confirms concentric thickening. The septum measures 24.1mms while the free wall measures 19.7mms. Upper limits normal is 14mms.
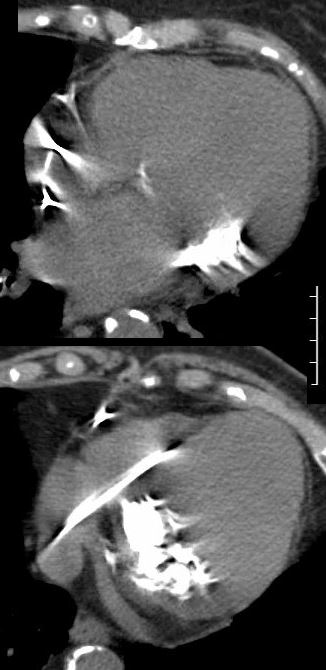
Cardiac Amyloidosis with Right Ventricular Infiltration CARDIAC AMYLOIDOSIS
Non gated sagittal CT through the RVOT shows RVH (right ventricular thickening) wall measuring between 6-7mm involving both the RV inflow as well as the outflow See Case 006
Delayed gadolinium in Short Axis Shows Diffuse Dominantly Subendocardial and Myocardial LGE in both LV and RV
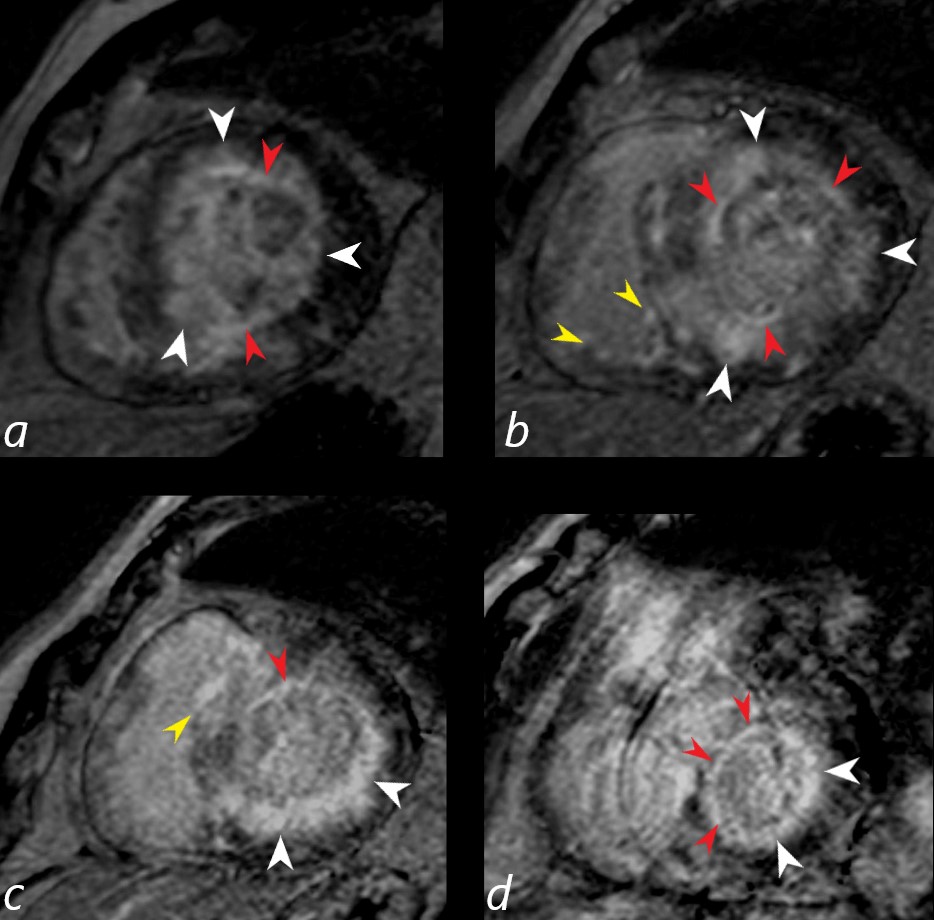
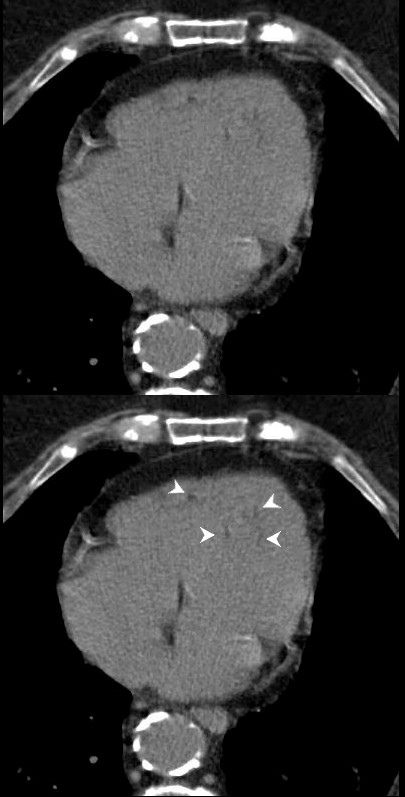
Gated short axis delayed gadolinium sequence through the base LV during diastole and shows subendocardial LGE (red arrowheads in a,b,c, and d, diffuse mid myocardial LGE (white arrowheads) (a,b,c,d) and subepicardial LGE in the RV (yellow arrowheads (b,c)
Ashley Davidoff MD See Case 006
- Key Issues for Cardiac Amyloid
- Difficult to null
Sarcoid Cardiomyopathy with Thickening of Both Ventricles Due to Biventricular Infiltration and Subepicardial LGE
Key Issues for Sarcoidosis
- Similar affinity for lymphatics as in sarcoid of the lungs
- Lymphatics of the heart are subepicardial
- LGE characteristically subepicardial
- Also patchy, multifocal nodular mid myocardial
- most characteristic
- free wall and
- medial basal septum (conduction abnormalities)
- Lymphatics of the heart are subepicardial
25-30% cardiac involvement
-
Other Infiltrative Disease with Biventricular Infiltration and Thickening
-
- hemochromatosis
- Less commonly
- Fabry disease,
- Danon disease, and
- Friedreich’s ataxia.
-
AD will discuss the following diagrams
“A” is for congo red Amyloid
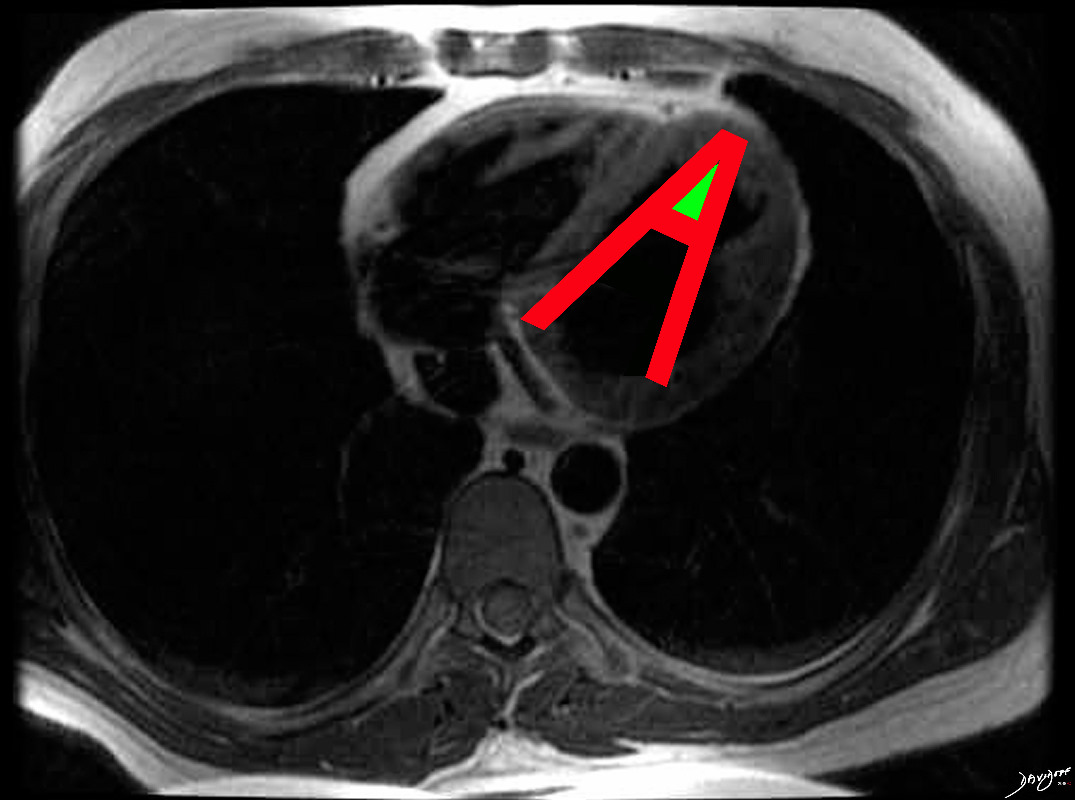
The hallmark of cardiac amyloidosis is LGE involving subendocardial regions with apical sparing and sometimes the atria
Ashley Davidoff MD
Re Other Chamber Involvement with Wall Thickening and Enlargement

In cardiac amyloidosis increased LV thickness is common , but may involve RV and atrial septum with bilateral atrial enlargement.
Ashley Davidoff MD
and Sarcoidosis
Disease Location and Form
The hallmark of cardiac sarcoidosis is LGE involving subepicardial regions of lateral free wall as well as medial basal septum but also mid myocardial with linear patchy and nodular forms.
Biventricular involvement is common
Sarcoidosis involves both ventricles and may cause bi-ventricular thickening
Ashley Davidoff MD
Would like you to tackle the concept of diastolic heart failure in our patient who is a 65 year old female with SLE and an infiltrative cardiomyopathy and presenting with dyspnea She does have CAD but also has an infiltrative disease
So the question is does she have diastolic heart failure to account for her symptoms
Diastolic Heart Failure
aka
Heart failure with preserved ejection fraction (HFpEF).
- Structural Abnormality
- Thick Wall Small cavity
- Enlarged Left Atrium
- Physiology
- Low Cardiac Output
- Elevated End Diastolic Pressures
Many causes
- Most common
- Aging
- Hypertension LVH
- Less Common
- Restrictive Cardiomyopathy
- Commonly caused by infiltrative heart diseases
- We have established in our patient that
- both her ventricles are thick walled
- making infiltrative disease most likely
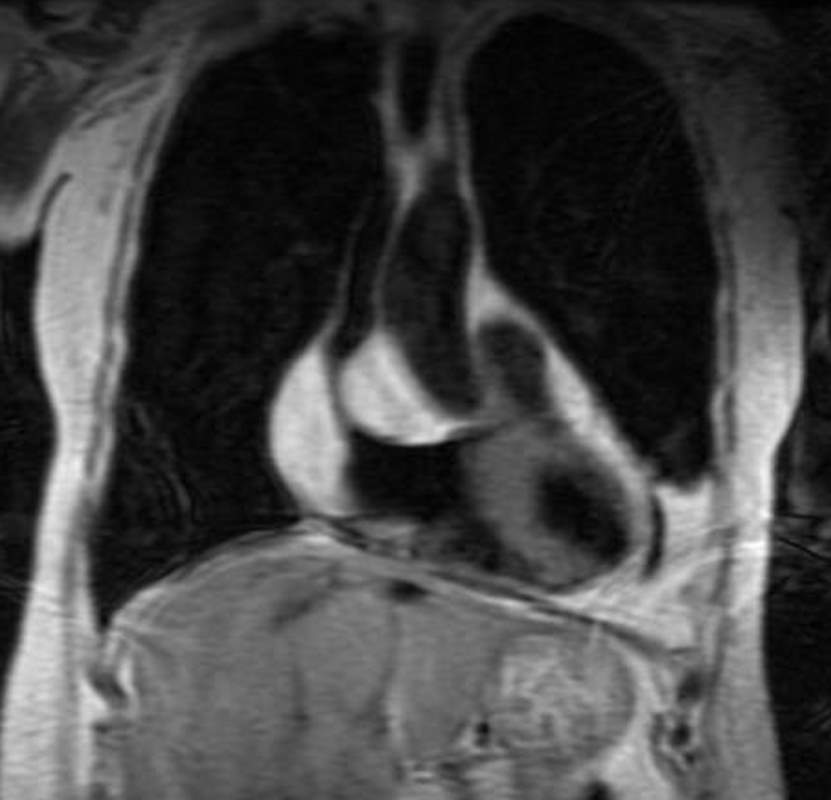
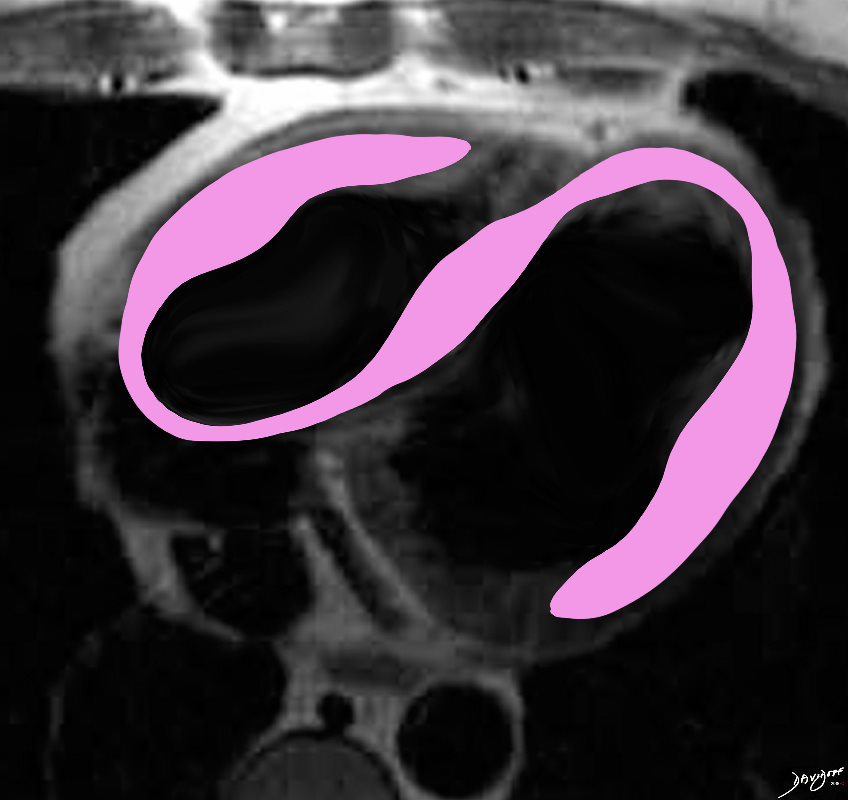
MRI with 4 chamber view from “black blood” T2 weighted imaging of a 65 year old female with longstanding history of SLE, Lupus Sjogren’s and Raynaud’s presented with 2 weeks of dyspnea and elevated troponins suggestive of a STEMI. Cardiac cath showed 2 vessel disease and she was referred for CABG. At surgery there were adhesions and the surgeon was unable to identify the coronaries as a result of the fibrosis. She was closed without surgery. She subsequently had a diagnostic MRI and endomyocardial biopsy which showed chloroquine related cardiomyopathy
Ashley Davidoff MD
-
Regarding other criteria
-
Is the cavity small? and
-
What does her ejection fraction look like?
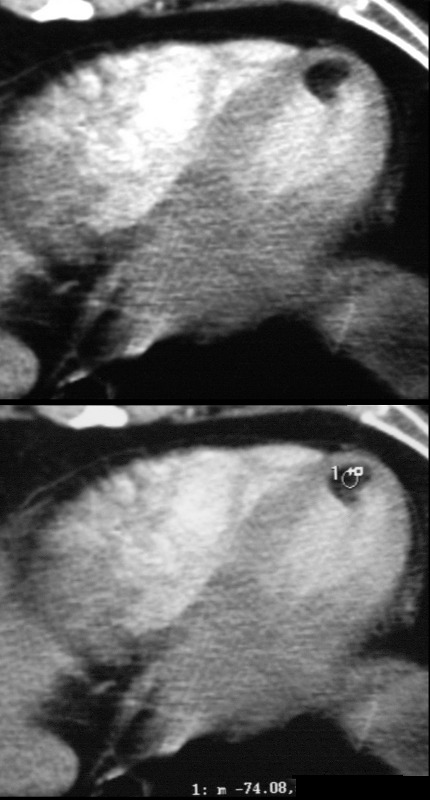
- Systole to left and diastole to right
-

The images on the right are taken at peak systole and those on the left are peak diastole. It would appear that volume in the cavity at peak systole on both views is about 1/2 the original volume suggesting an EF of about 50%
Yes the LV cavity is small both by measurement and subjective assessment
-
Re EF (subjective)
-
the end systolic volume is small but is about 1/2 the volume of the end diastolic volume
-
-
Re EF (objective)
-
Calculated EF was 60%
-
-
Re LAE?
-
NORMAL SIZED ATRIAL CHAMBERS Both LA and RA look normal
Cardiac Output/Index
Calculated cardiac Index was 2.8 L/min/m2 ( normal range for CI is 2.5 to 4 L/min/m2.)
-
So she has some features of diastolic heart failure
- Small LV cavity
- Thick walled LV
- CI lower limits normal
- But
- LA is normal in size
- Calculated wedge pressure is normal
Nulling the Myocardium
Normal
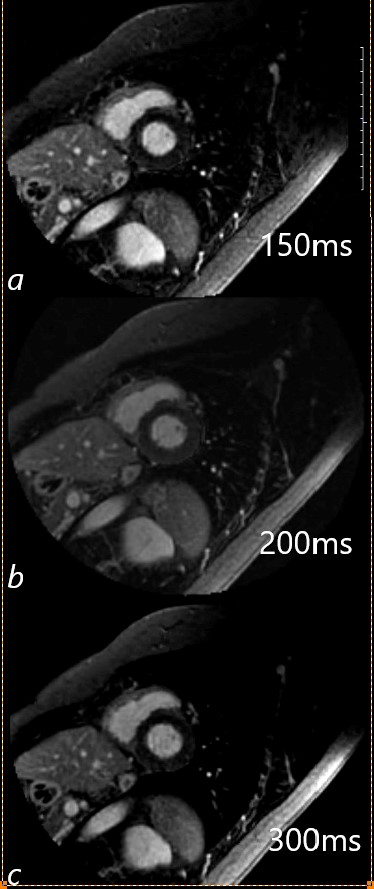 The MRI shows 3 images with different IR inversion times to try and individualize the maximal nulling of the myocardium prior to the evaluation for delayed gadolinium enhancement.
Our Patient
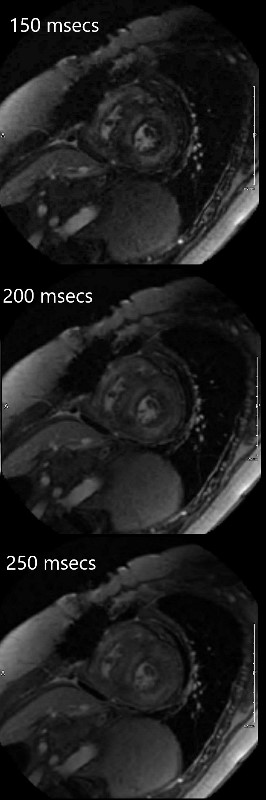
We were unable to null the myocardium (both LV and RV) because of diffuse infiltration This appearance is highly characteristic of amyloid of the heart
Conclusion
SUMMARY CHLOROQUINE CARDIOMYOPATHY
So we know we have diffuse infiltration of both the LV and RV infiltration based on our nulling attempts Amyloidosis is the classical example of this entity
Amyloidosis Leading Diagnosis
However
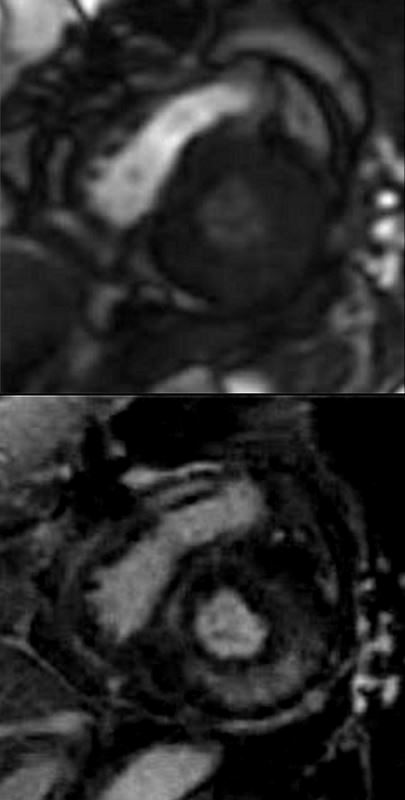
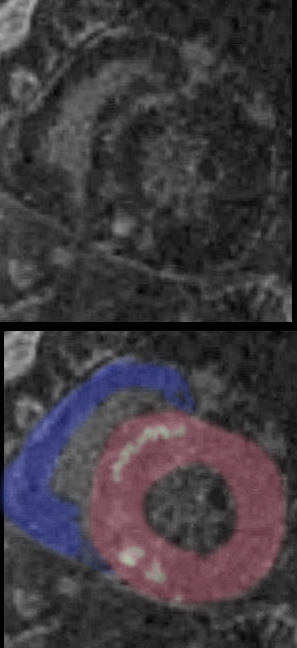
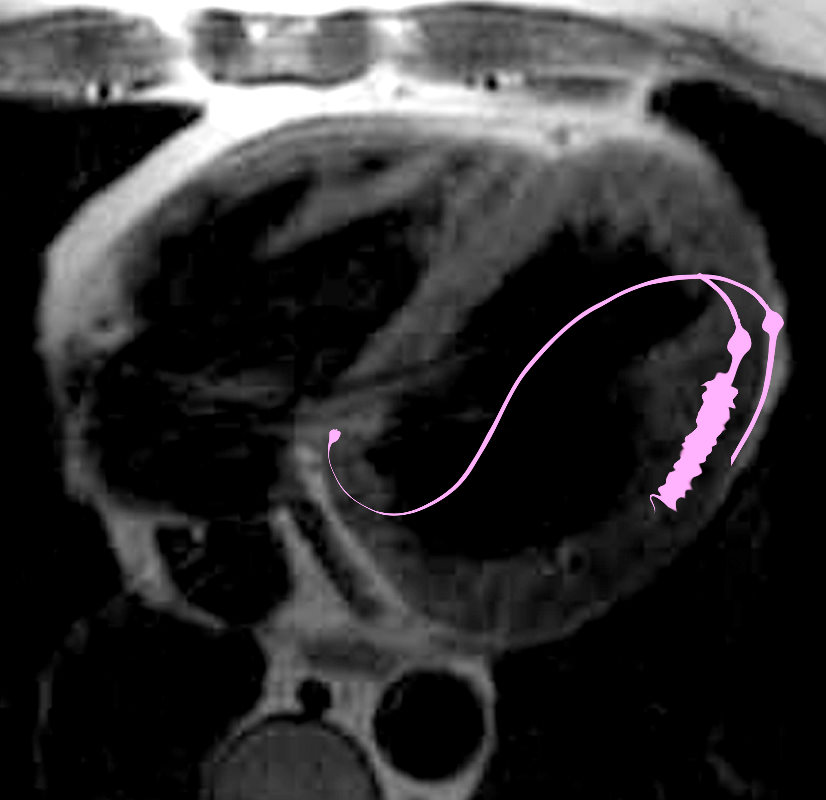
Short axis during first pass while still in RV (above) and then delayed post gadolinium shows diffuse mid myocardial circumferential LGE enhancement consistent with an infiltrative cardiomyopathy
Ashley Davidoff MD

Short axis images on the delayed post Gad images show 3 rings of LGE. Image b (correlate with image a) is through the body of the LV and shows mid myocardial LGE seen as an almost complete ring of diffuse accumulation (green arrowheads), a thin ring of more peripheral mid myocardial LGE (yellow arrowhead) together with probable pericardial LGE (yellow arrow head)
In image d (correlate with image c) near the apex of the heart, there are 2 distinct rings of a linear morphology in the mid myocardium. The inner ring (green arrowhead) has some focal nodularity and an outer mid myocardial ring (yellow arrowhead) . Subepicardial or pericardial enhancement is suggested as well (pink arrowhead).
Ashley Davidoff MD
The hallmark of cardiac amyloidosis is
LGE involving subendocardial regions with apical sparing
Ashley Davidoff MD
As we learned
In cardiac amyloidosis increased LV thickness is common , but may involve RV and atrial septum with bilateral atrial enlargement.
Ashley Davidoff MD

It was difficult to null the myocardium on both these patients.
The images are organized from the atria (top images through the bases, bodies and apices (lowest images) of the left ventricles.
The chloroquine cardiomyopathy shows no LGE of the atria, but progressive linear circumferential mid- ventricular LGE through to the apex
The amyloid cardiomyopathy hase LGE in both atrial walls, circumferential LGE through the base and body o the LV but sparing of the apex.
Ashley Davidoff MD
amyloid case 131429
Summary
65 year old female with longstanding history of SLE, Lupus Sjogren’s and Raynaud’s presented with 2 weeks of dyspnea and elevated troponins suggestive of a STEMI. Cardiac cath showed 2 vessel disease and she was referred for CABG. At surgery there were adhesions and the surgeon was unable to identify the coronaries as a result of the fibrosis. She was closed without surgery. She subsequently had a diagnostic MRI and endomyocardial biopsy which showed chloroquine related cardiomyopathy
Ashley Davidoff MD
-
WORK in PROGRESS
-
LEARNING through TEACHING
-
NOTES SCALES and MUSIC
LEARNING AND PERFECTING SKILLS