Ganesh Athappan MD Ashley Davidoff MD
Definition
The left ventricle , the largest and most muscular of the four chambers of the heart receives oxygenated blood from the left atrium via the mitral valve, and pumps it into the aorta via the aortic valve. Structurally it is a hollow muscular conical chamber which can be divided into an inlet , apical trabecular and outlet components. Functionally it receives oxygenated blood from the left atrium and pumps it forward through the aortic valve into the aorta to supply oxygenated blood to the tissues of the body.
Diseases of the left ventricular myocardium lead to systolic or diastolic pump failure characterized by inability of the LV to pump blood at a rate commensurate with the requirements of the metabolizing tissues and/or pumps only from an abnormally elevated diastolic filling pressure.
Diagnosis of LV failure is suspected in patients presenting with symptoms of exertional dyspnea, orthopnea, PND, fatigue, weakness and nocturia. On examination patients may have signs of frank pulmonary edema with bibasilar coarse crackles. BNP levels are raised in the serum and an EKG may show LVH. Chest radiography shows an enlarged cardiac silhouette and alveolar edema with pleural effusions and bilateral infiltrates in a butterfly pattern. 2D echocardiography is the easiest and cost effective method to determine LV systolic and diastolic function.
Medical therapy is the cornerstone for management of LV dysfunction, with heart transplant needed in a few cases.

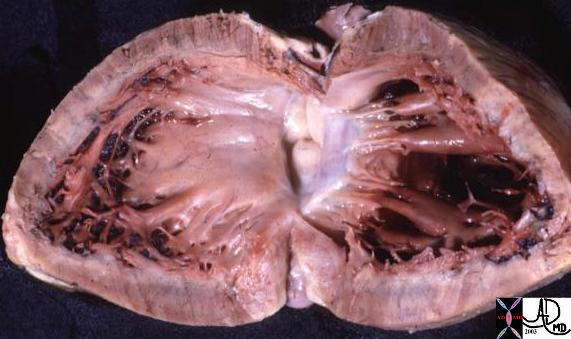
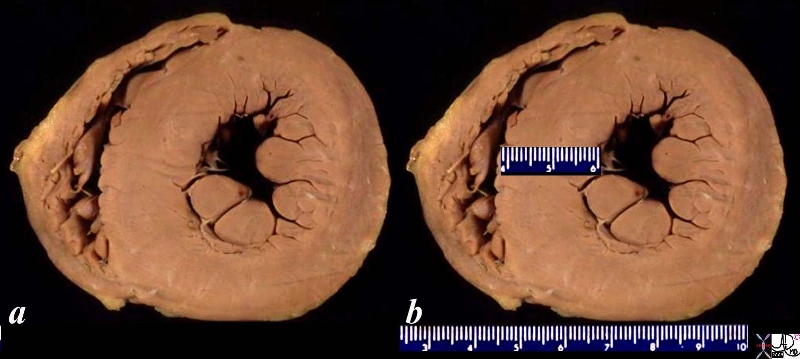
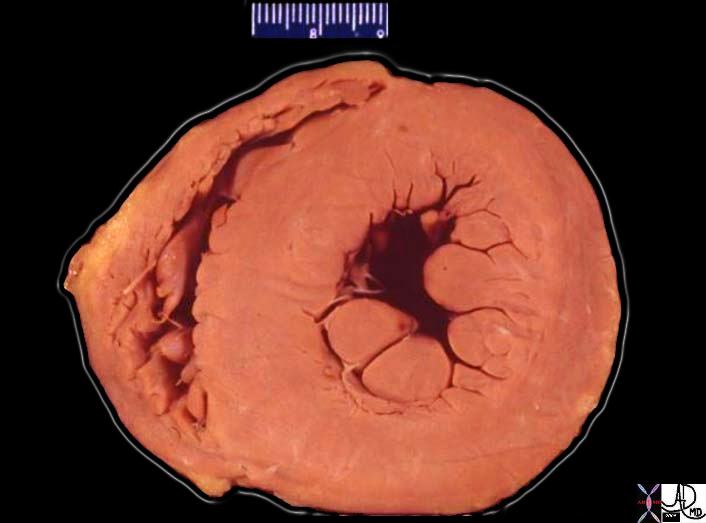
This normal anatomical specimen has been sectioned in long axis along the ventricular septum; then opened like a book with the septal wall seen on the left side of the image, and the free wall with the pair of papillary muscles seen on the right of the image. Note the fibrous continuity of the anterior leaflet of the mitral valve with the cusps of the aortic valve..
code 15389c05.8s Courtesy Ashley DAvidoff MD copyright 2009
Principles
Structural Considerations
The left ventricle is a conical muscular chamber which forms a small part of the sternocostal surface but a considerable part of the diaphragmatic surface of the heart1.It also forms the apex of the heart. The left ventricle can be subdivided into three components – inlet , apex and outlet, with a septal surface, and a free wall
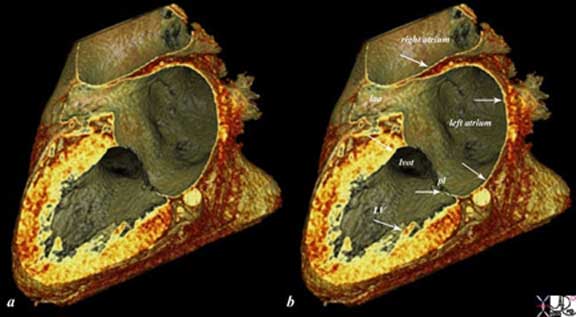
The reconstructed CTscan shows the thin endocardium (white arrows throughout the heart – which is in fact one continuous sheet of tissue connected across the whole circulatory system. The thin white layer is seen in the left atrium, left atrial appendage (laa) over the posterior leaflet of the mitral valve (pl), in the left ventricle (LV) and in the right atrium. The surface of the left ventricle, left ventricular outflow tract (lvot) and right atrium are also lined by the endothelium. Ashley Davidoff
TheCommonVein.net
47824c02.8s
Size
The left ventricle is the largest of the 4 chambers. Echocardiography offers an excellent tool for the measurement of left ventricular size:
Posterior LV thickness:
0.6-1.2 cm (diastole),
Internal diameter
3.5 -5.6 (diastole)
2- 4cms (systole) ,
Mass:
92± 16.0 gm/m2
End-Diastolic Volume:
70 ± 20.0 ml/m2.
Stroke Volume:
45± 13.0 ml/m2
Ejection Fraction:
0.67 ± 0.08 = 50-85%
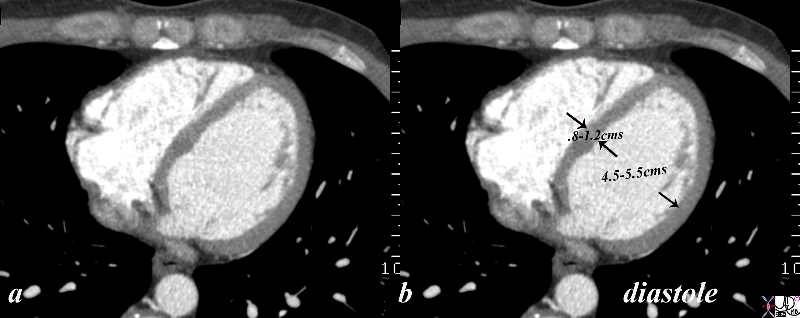
The gated CT scan was taken in diastole and shows the normal left ventricular dimensions which for the left ventricle wall is between .8 cms and 1.2 cms, and for the cavity is 4.5-5.5cms. the measurement should be taken at the level of the papillary muscles which is in mid ventricular cavity.
code
Courtesy Ashley Davidoff copyright 2018
34765c02.8s
Normal Echo
Normal CT
Normal MRI
|
MRI Normal |
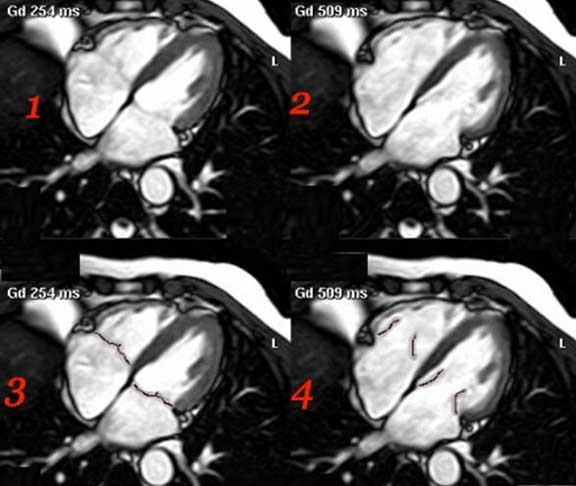
| This MRI series demonstrates the heart in systole and diastole. Image 1 demonstrates ventricular systole. The atrial chambers are full, the A-V valves are closed and the ventricular chambers are contracted. Image 3 is a color overlay of the closed A-V valves of image 1. Image 2 demonstrates ventricular diastole. The atrial chambers are emptying, the A-V valves are open and the ventricular chambers are full. Image 4 is a color overlay of the open A-V valves of image 2.
Courtesy of Philips Medical Systems and modified by Ashley Davidoff M.D. 32062 |
|
Normal MRI Sagittal View |
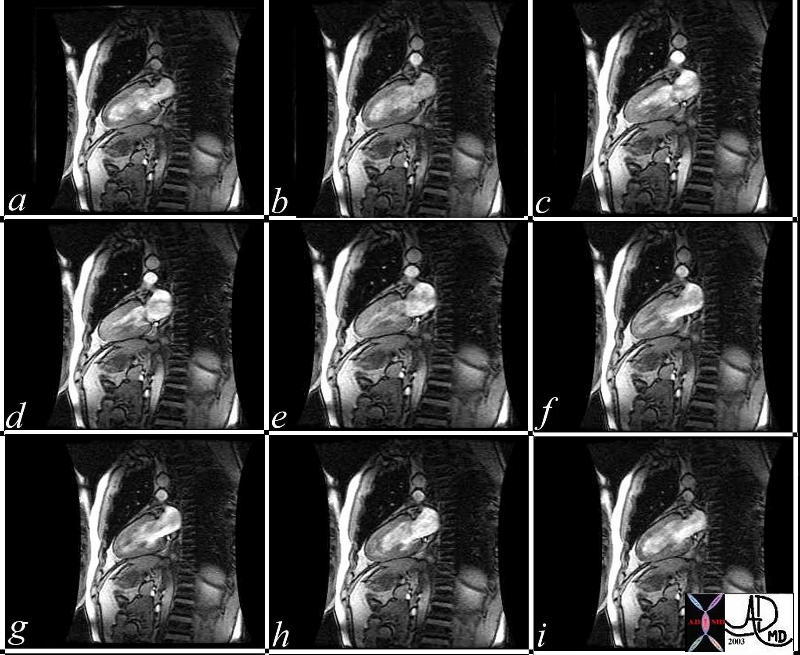
| This series of MRI images of the LV and LA are a beautiful sagittal depiction of a normal heart in systole and diastole. Note the changes in LV cavity size as the heart in diastole (a) goes through progressive systole (b,c,d,e,f) and then goes through diastole again. (g,h,i)
Courtesy Rebecca Schwartz MD 38132c code |
Size – LV Enlargement
LV Hypertrophy
Size – LV Hypertrophy by CXR
|
|
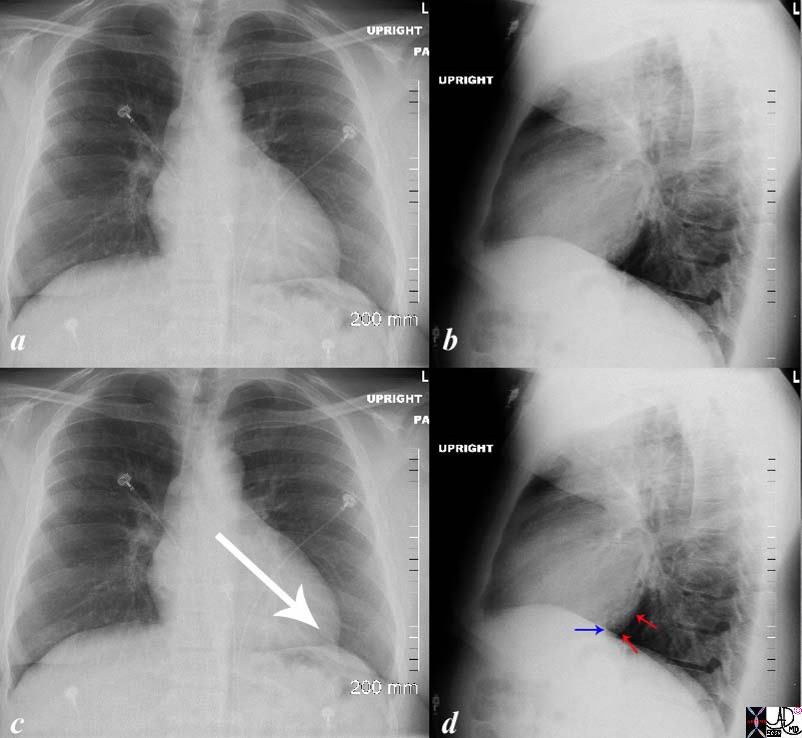
| 76788c02.8s The PA and lateral chest x-ray shows evidence of cardiomegaly with the left ventricle pointing down and out in the PA examination (white arrow c) and taking up more than a third of the diaphragmatic space on the lateral, with posterior bulging so that the IVC (blue arrow) is anterior to the IVC. The method is to draw a vertical, 2,5cms line up from the junction of IVC with diaphragm and then if the border of the LV is greater than 2.5 cms from the vertical line then LVH is diagnosed. Most the time the posterior positioning of the LV in relation to the IVC suffices to enable the diagnosis. These findings are characteristic of LVH – with the change mostly in shape on the PA rather than an overt change in size. code CXR heart cardiac left ventricle size hypertrophy shape LVH left ventricular hypertrophy CXR chest X-ray plain film of the chest Copyright 2009 Courtesy Ashley Davidoff M |
Size – LV Hypertrophy by Angiography
|
|
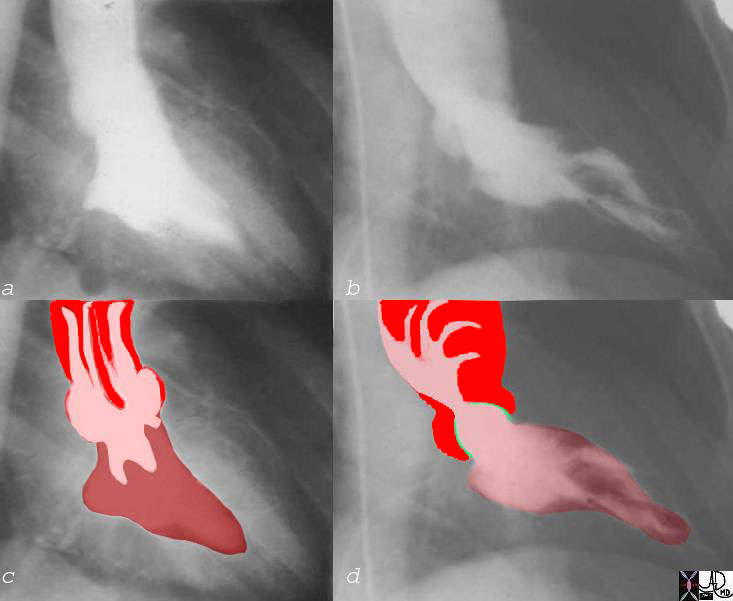
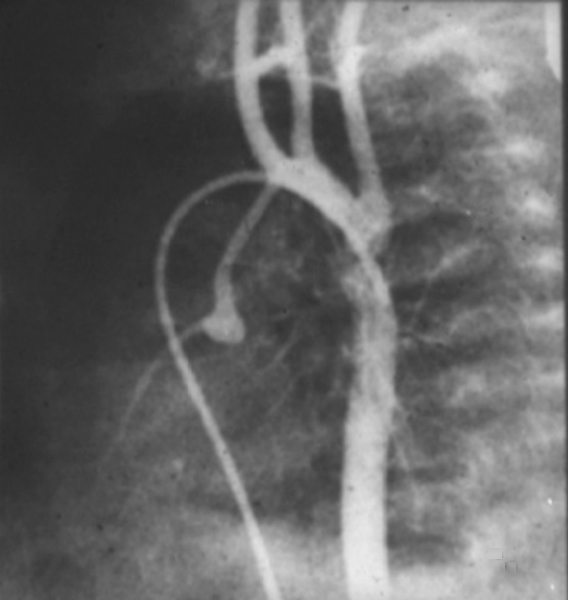
| 07969c06 heart aorta left ventricle LV normal anatomy fx hypercontractile ballet slipper ejection fraction = 80% AV aortic valve thickened doming ejection click jet turbulence shear stress post stenotic dilatation LV angiogram angiography Courtesy Ashley Davidoff MD aortic valve 07969c03 07969c02 07969c04 |
Size – LV Hypertrophy by CT
|
|
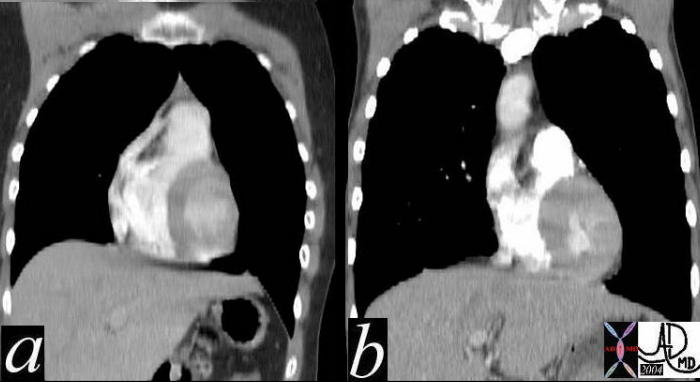
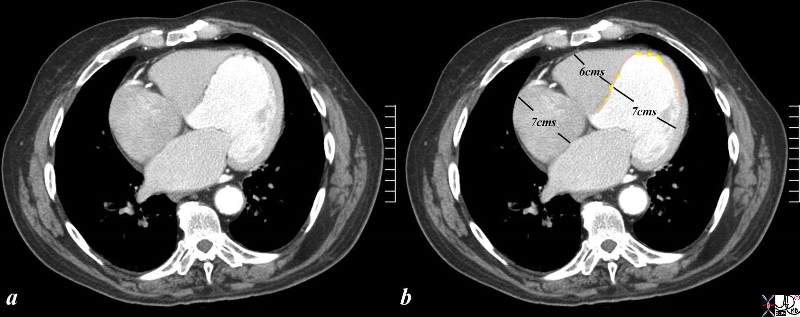
| Coronal reformats through the chests of two different patients. They are approximately at the same level of the RVOT. The left image (a) is normal, while image b shows concentric thickening of the LV. Courtesy Ashley Davidoff MD 39088c01 code cardiac heart normal LVH LV hypertrophy |
|
|
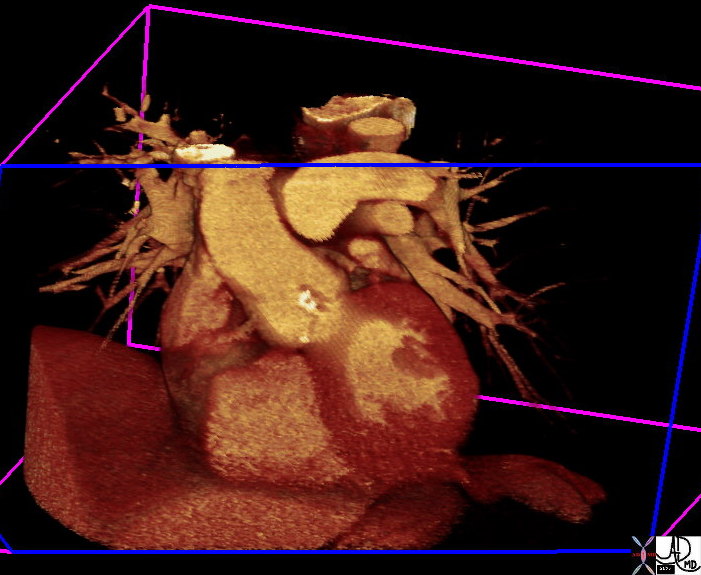
| 39699.800 aorta aortic valve aortic annulus calcified calcification aortic sclerosis aortic stenosis LVH left ventricle hypertrophy CT scan volume rendering Courtesy Ashley Davidoff MD |
Size – LV Hypertrophy by MRI
|
|
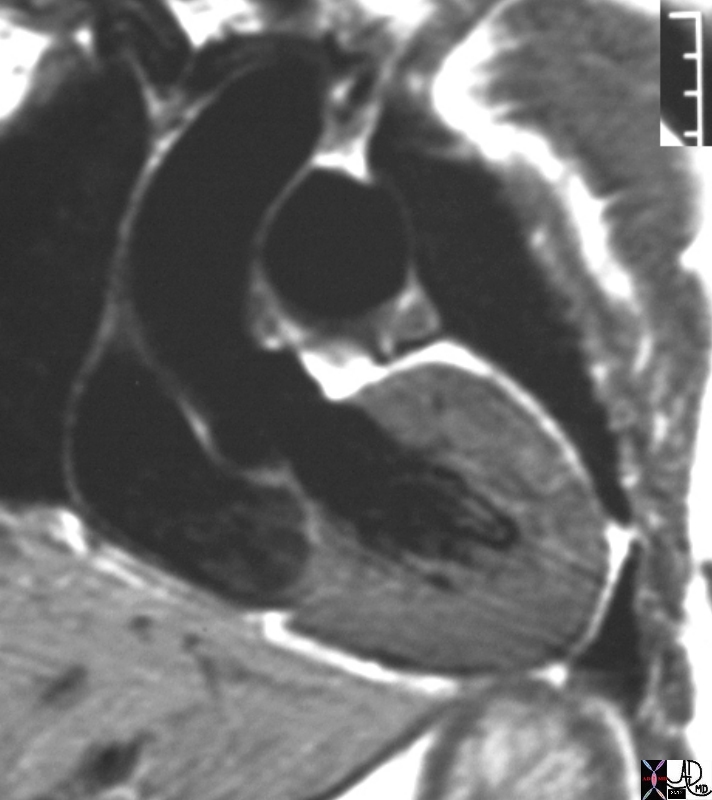
| 16906.800 heart LV left ventricle aorta coarctation left ventricular hypertrophy fx LVH concentric hypertrophy dx coarctation imaging radiology T1 weighted MRI Courtesy Ashley Davidoff MD |
Size – LV Idiopathic Hypertrophic Subaortic Stenosis (IHSS)
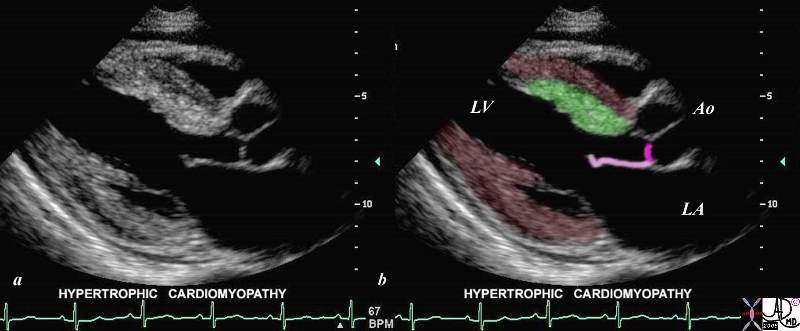
This gray scale echo of the heart shows the left ventricle, anterior (light pink) and posterior leaflets of the mitral valve, the aortic valve (dark pink), and the base of the aorta. There is a focal thickening of the ventricular septum (green) in the left ventricular outflow tract just proximal to the aortic valve. The region is also slightly more echogenic than the remaining myocardium (maroon). This case demonstrates a case of asymmetric septal hypertrophy or muscular subaortic stenosis.
Courtesy Philips Medical Systems 33134 33134c04.8s
CT scan
| This series of CTscans shows a normal Left ventricular outflow tract overlayed in bright red in a, with normal septum in green (c) contrasted to a patient with IHSS, where the LVOT is narrowed (b and bright red in d) with a thickened septum with overlay in green (d). Courtesy Ashley DAvidoff MD 39208c01 code cardiac heart CTscan interventricular septum thickened IHSS imaging radiology CTscan |
Size – LV Dilatation

Complex Size Changes with Disease
Atrophy Caused by Old Infarction, Swelling with New Infarction, Compensatory Hypertrophy and Normal
This pathological specimen shows a short axis through the heart with the left ventricle (right of image) and the right ventricle (left of the image). The free wall of the left ventricle contains the papillary muscles and is slightly thickened either as compensation to the remaining diseased myocardium or due to other comorbid diseases such as hypertension or aortic stenosis. There is a fresh infarction (black) posteriorly in the left ventricle extending to the posterior wall of the RV as well. The septum is thinned and fibrotic from an old infarction. The anterior wall of the right ventricle is hypertrophied.
Ashley Davidoff MD
15365b01b
aka heart-anatomy-P-031.Size – LV Dilatation CXR
Size – LV Dilatation – Echocardiography
|
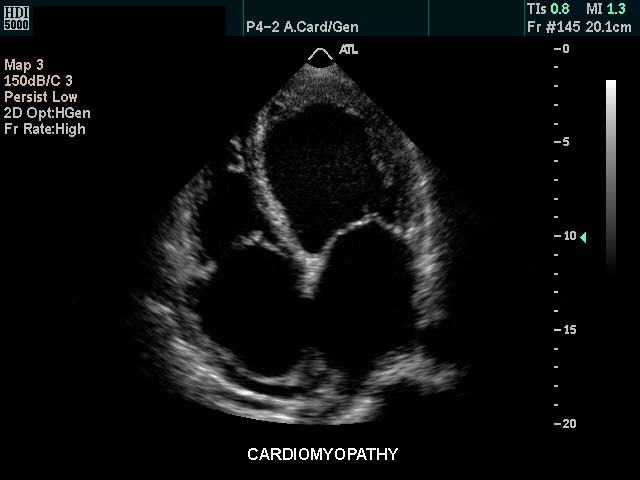
Dilated LV in a Patient with a Cardiomyopathy |
Size – LV Dilatation CT
|
Ischemic Cardiomyopathy |
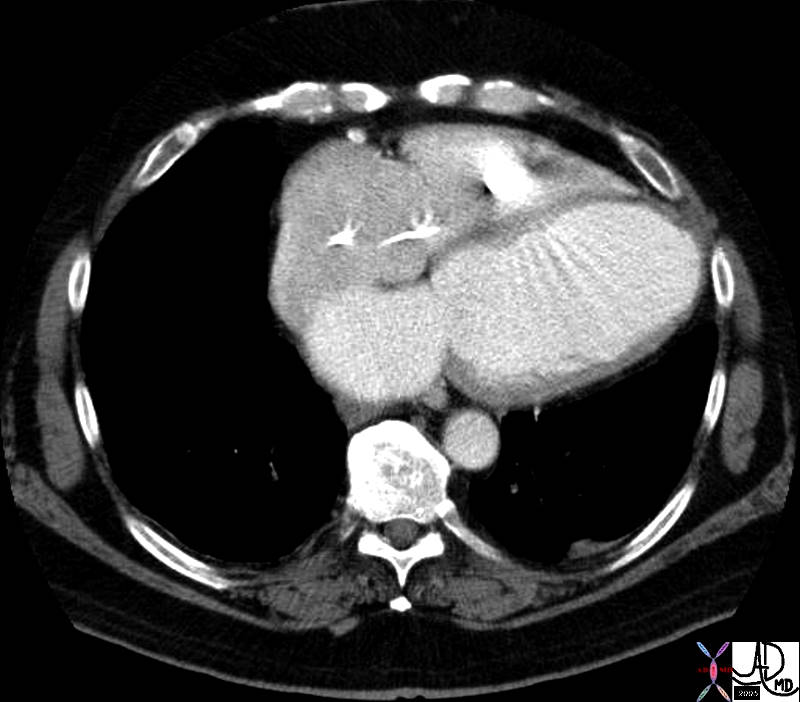
| The CTscan through the LV in this non gated examination shows an enlarged LV with a particularly prominent LV apex with thinned myocardium suggestive of a dyskinetic segment.
42394.800 CTscan Davidoff MD copyright 2009 |

This is an external and frontal view of the heart. The vessel that you see coursing straight down the center of the heart is the left anterior descending artery, (LAD) that runs anterior to the ventricular septum (vertical limb of the cross) separating the right and left ventricles. Conceptualize the triangular shape of the right ventricle, and the ovoid almost football shape of the left ventricle.
Courtesy of Ashley Davidoff M.D. 32078
Shape
The overall shape of the left ventricle is conical.
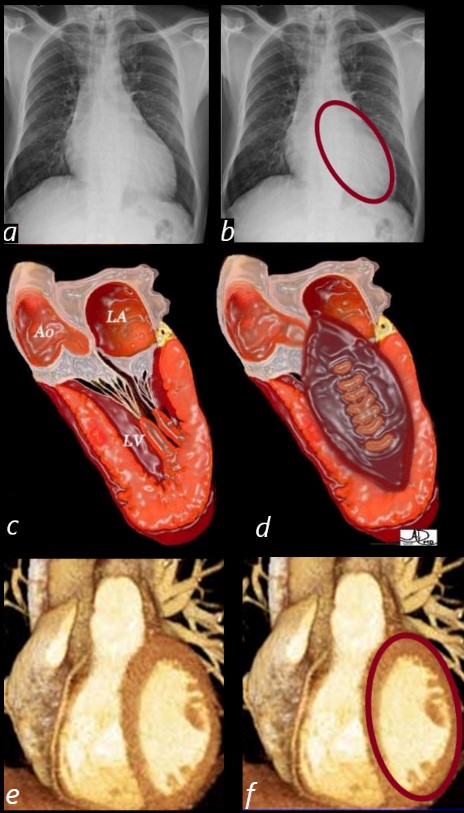
The enlarged LV (a,b) is shaped like an oval and it is likened to a rugby ball or an American football placed on the field at kick off time. LVE on CXR is mostly assessed by an increased cardiothoracic ratio as well as the accentuation of the ovoid shape. (lower images c, d,e, f)
Ashley Davidoff MD
Shape LV Fetal Ultrasound
|
Fetal Ultrasound |
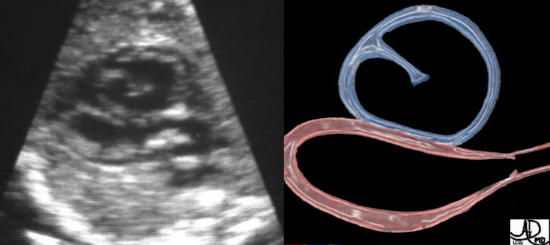
| This is a fetal US with an oblique coronal projection revealing a normal thick walled LV with its football shape (red overlay). The RV which has a rounded shape in this projection, is overlaid in blue. The anterolateral papillary muscle can be seen projecting into the RV chamber (sinus). Courtesy of Ashley Davidoff M.D. |
Shape LV Angiography
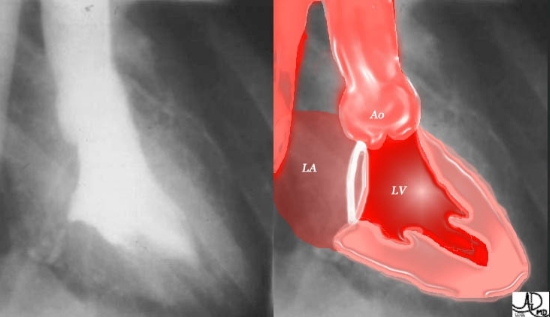
This normal left ventriculogram is taken in the classical right anterior oblique (RAO) projection, enabling an excellent profile for the LV and the mitral valve plane. The annulus of the valve is inferred as a white ring in the color overlay.
Courtesy of Ashley Davidoff M.D.32120
Shape LV – CT Scan
|
Diastolic Shape RAO CTscan |
| The oblique sagittal reconstructed LV is a diastolic reconstruction showing a rounded apex. The apparent thinning of the apex is caused by the obliquity of the cut and is an artifact since this was an otherwise normal study. The elongated LV outflow tract is well demonstrated in this view. Additionally the normal SVC with high density contrast is well seen.
45193 vein SVC superior vena cava RA right atrium right ventricular inflow RV LV left ventricle LVOT sinus of Valsalva aortic valve heart cardiac normal anatomy CTscan Courtesy Ashley Davidoff MD |
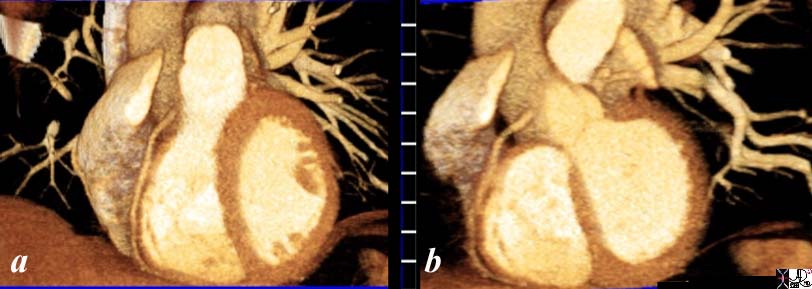
| 31235c.81s The CT scan of the heart has been reconstructed in the coronal view with image a being slightly anterior to image b. In image a, the triangular nature of the RV is noted and inimage b the ovoid nature of the LV is noted heart cardiac CTscan RV LV Ao PA right ventricle left ventricle aorta pulmonary artery RCA right coronary artery shape normal anatomy CTscan coronal reformat Courtesy Ashley Davidoff copyright 2009 all rights reserved |
Shape LV – Posterior Wall
|
|
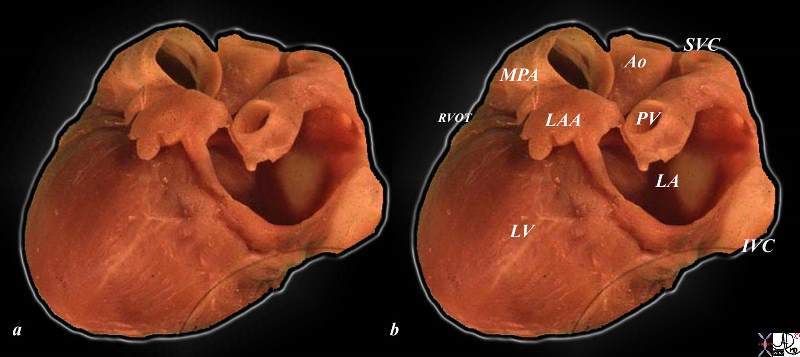
| 06559b03c01.8s The post mortem specimen was distended with fixatives including formalin under gravitational pressure, and then fixed in wax. The heart is viewed in a lateral projection tipped slightly to show the lateral and posterior wall of the LV. The main pulmonary artery (MPA), right ventricular outflow tract (RVOT), left atrial appendage (LAA) aorta(Ao), superior vena cava (SVC) pulmonary vein (PV) left atrium (LA) left ventricle (LV) and inferior vena cava (IVC) are shown. The distensible nature of the heart is demonstrated. code heart cardiac anatomy normal fixed heart right ventricular outflow tract left ventricle main pulmonary artery aorta left atrial appendage pulmonary vein left atrium inferior vena cava superior vena cava RVOT LV MPA Ao PV IVC SVC LA LAA gross pathology wax specimen anatomy Courtesy Ashley Davidoff copyright 2009 all rights reserved |
Shape LV – Enlargement by CXR
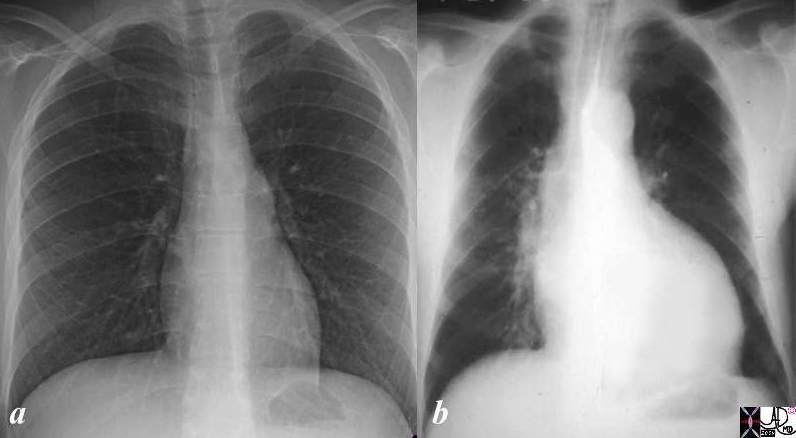
The Oval Heart Dominates
The normal chest X-ray (a) is placed besides the CXR of a patient with an enlarged left ventricle. The oval shape of the left ventricle dominates the appearance together with a cardiothoracic ratio that is greater than 50%
Courtesy Ashley Davidoff MD copyright 2009 08136c01.81s
Shape LV – Enlarged Angiography
|
|
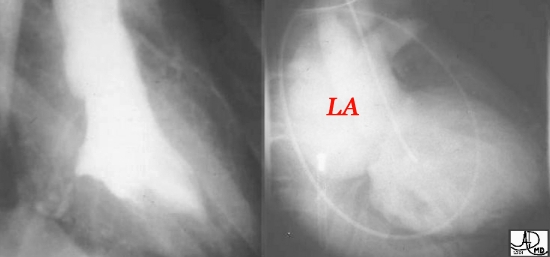
| Image 1 on the left, is the normal ventriculogram shown previously in the “Mitral Valve – Imaging” page. Contrast is injected directly into the LV, via a catheter which passes from the aorta through the aortic valve into the LV, and hence no contrast should pass into the LA. In contrast the ventriculogram in the same RAO projection in image 2, shows the posteriorly positioned LA filled with contrast. This is regurgitation of contrast called mitral regurgitation, the same condition as the previous two echocardiograms. Courtesy of Ashley Davidoff M.D. 32124 |
Shape LV – Enlarged MRI
Shape LV – Aneurysm
|
|
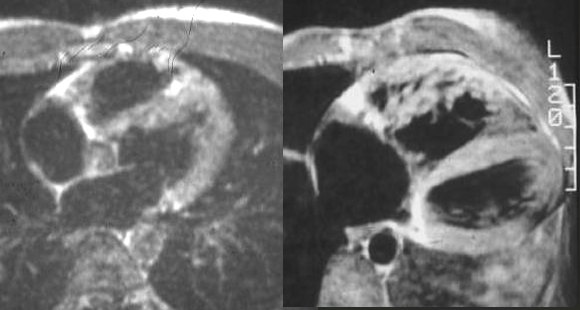
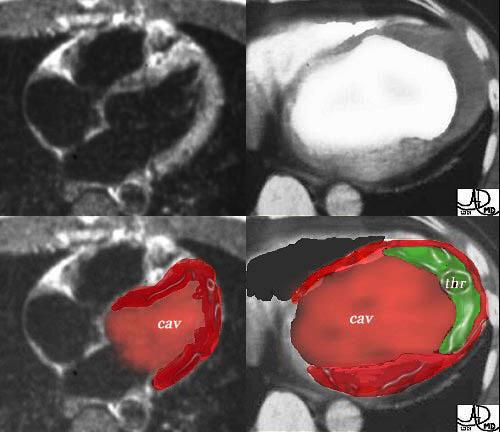
| The first image on the left is a normal axial MRI of the LV. In the image on the right, the LV cavity is too large, has a rounded and rather full apex, and has thinned septal apical walls. The color overlay shows the expanded LV cavity in the images on the right with the thrombus in the LV apex (green overlay) Courtesy of Ashley Davidoff M.D. 32131 |
Position
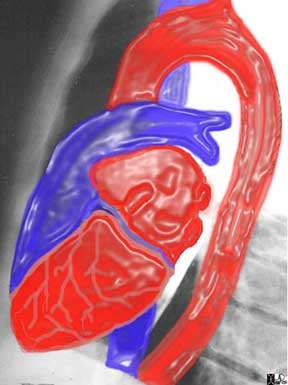
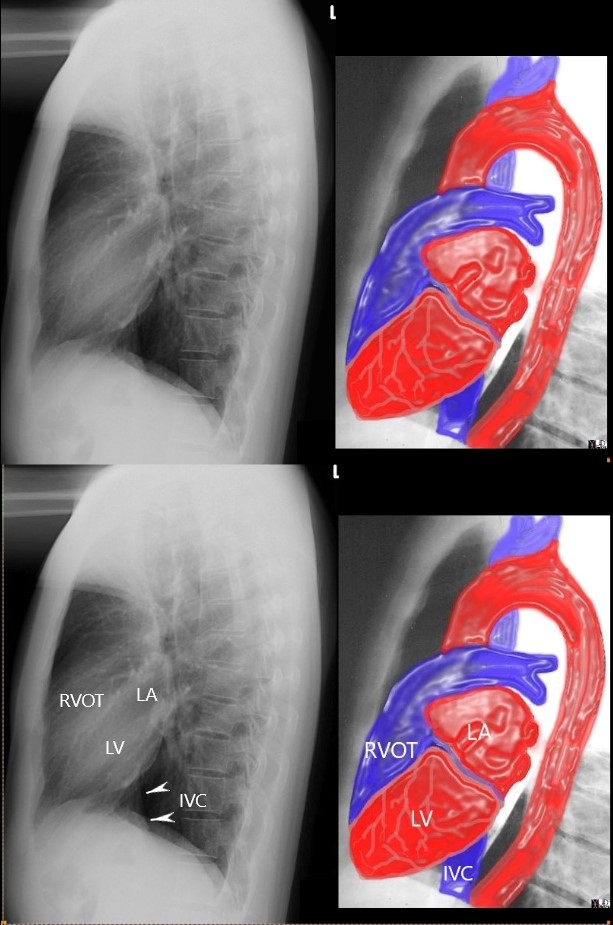
The left ventricle lies in the middle mediastinum and is enclosed in the pericardium. It sits obliquely in the chest, behind the body of the sternum and the left inferior costochondral junctions, and projects from the midline into the left half of the thoracic cavity.
|
|
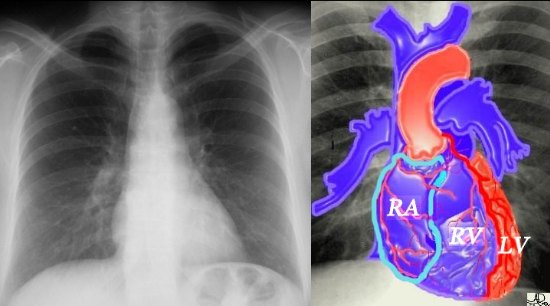
| If we were to “crack open” the chest of the chest X-ray, the structures that would dominate this bloody black and white scene, would be the right sided chambers. The right ventricle (RV) would be the dominant anterior chamber. The right atrium (RA) would form the border with the right lung, and the RV would form the dominant interface with the diaphragm. The RA would of course be slightly posterior to the RV. The left border would be formed by the left ventricle. Courtesy Ashley Davidoff M.D. 32064 code cardiac heart normal RA RV RVOT LV AO RPA LPA normal anatomy imaging CXR chest X-ray plain film |
LV Character
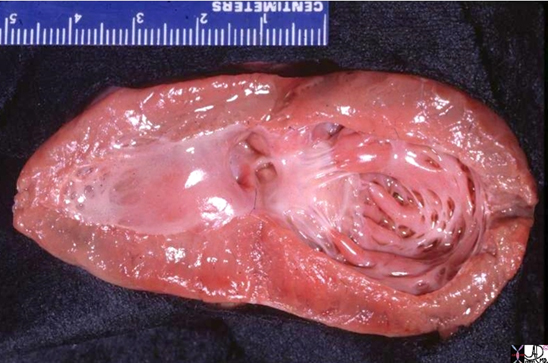
Shining Glistening Endothelium of the Left Ventricle
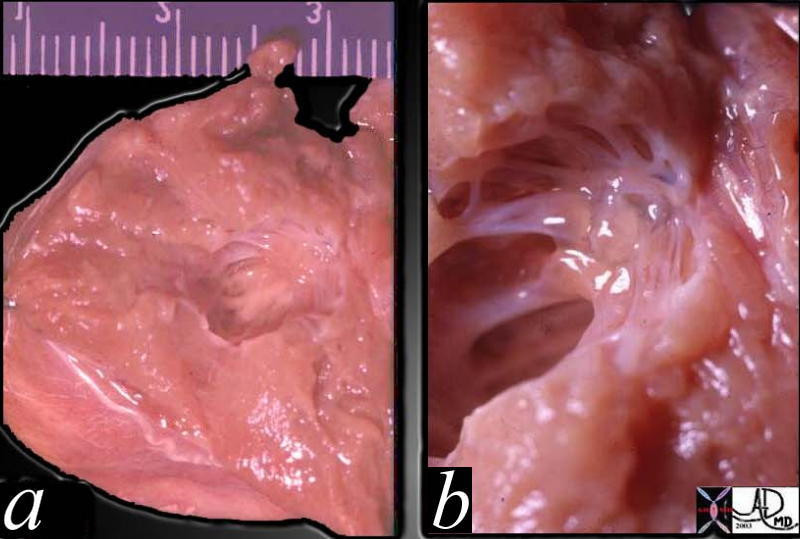
The left ventricle that has been opened along the ventricular septum shows the septal wall to your left and the free wall with the papillary muscles to your right. Note the glistening endothelium which has a whitish sheen. The myocardium lies directly under the endocardium. It is lighter red, muscular and rubbery. Note also the two sets of papillary muscles, the fibrous nature of the valves and the fibrous continuity of the mitral valve with the aortic valve. A VSD is noted on the superior aspect of the septum. Courtesy of: Ashley Davidoff, M.D.
08345b.8
|
|
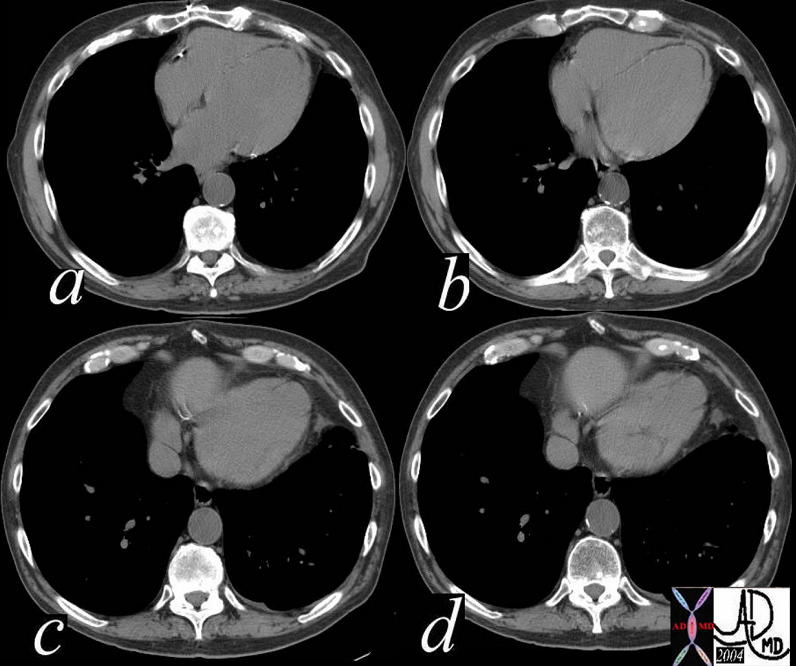
| This series of non contrast CT scans through the inferior aspect of the LV shows a thin lucency of fat density which is located on the endocardial side of the myocardium. This suggests that there is significant associated thinning of the myocardium. There are a few punctate dystrophic calcifications in the septal component of the lucency. (a,b) The lucent abnormality also extends to the apex and the free wall of the LV. In images c and d the apex bulges forming an apical aneurysm. The findings are consistent with previous infarction with fatty changes in the infarcted region. Courtesy Ashley Davidoff MD. 38325c code cardiac heart LV apex septum free wall lucent fat calcification MI aneurysm CAD IHD imaging radiology CTscan |
|
|
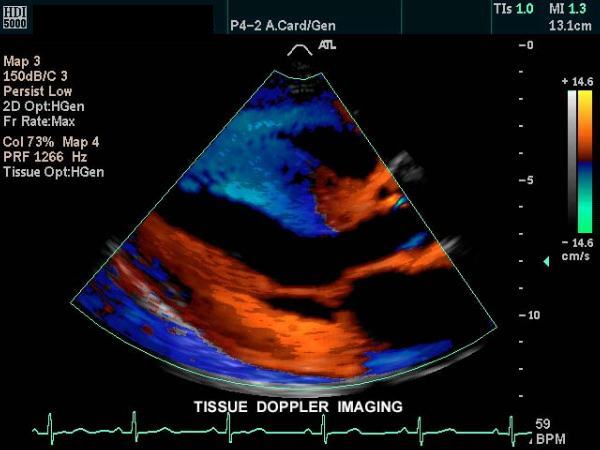
| This tissue doppler echo of the heart showing a long axis view, and demonstrating a normal left ventricle, mitral valve and aorta. Courtesy Philips Medical Systems 33182b normal cardiac heart echo tissue doppler MV LV AOimaging cardiac echo |
|
|
| This is a CT of the chest at the level of the heart demonstrating a curvilinear calcification at the apex of the left ventricle. This calcification is most likely in the myocardium of the apex of the left ventricle, caused by dystrophic calcification of infarcted myocardial tissue. Alternatively it may be within thrombus in the LV apex, secondary to an aneurysm of the apex. The shape of the calcifcation medially as it courses up the septum, makes pericardial calcification unlikely. In addition a faint soft tissue density of normal pericardiium can be seen anterior to the curvilinear calcification. Pericardial calcification is usually present more commonly over the right ventricle. Courtesy Ashley Davidoff MD. 25708 code heart LV apex curvilinear calcification probable remote myocardial infarction cardiac imaging radiology CTscan |
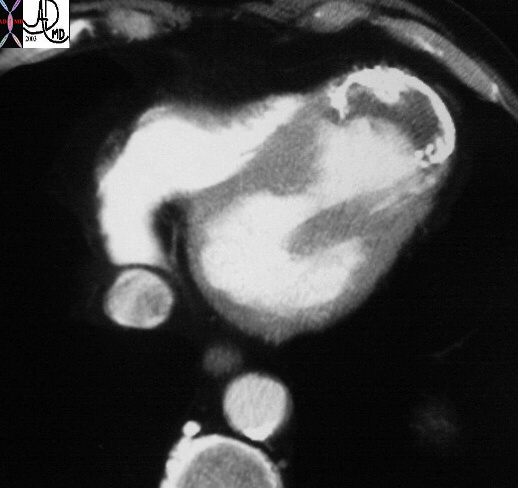
|
| This cross sectional CT image of the heart shows calcified apex of the left ventricle associated with thrombus, characteristic of an LV aneurysm. The cause is almost certainly secondary to coronary artery disease and ischemic heart disease with secondary myocardial infarction. Courtesy Ashley Davidoff MD. 30472 code heart LV apex IHD CAD aneurysm calcification calcified MI cardiac imaging radiology CTscan |
|
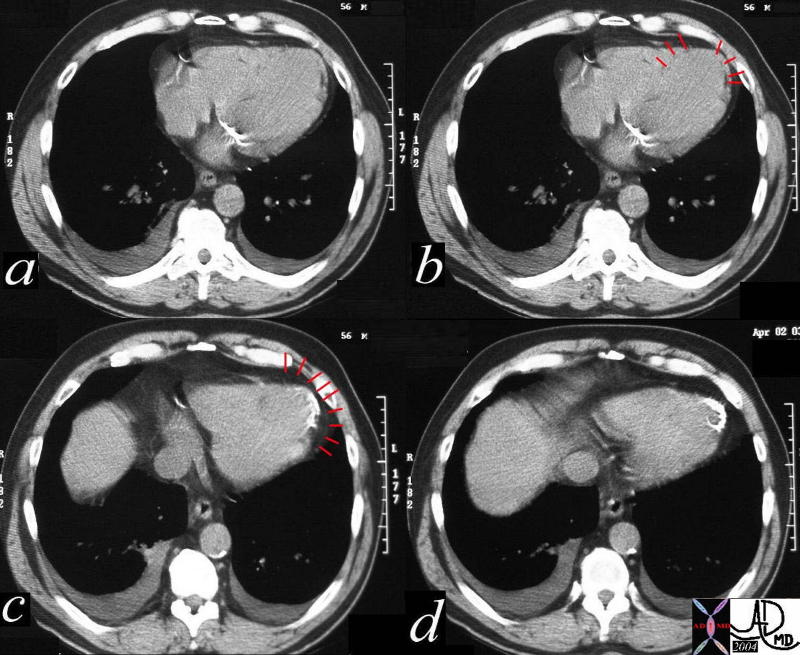
| This series of CT image shows a faint curvilinear lucency in the apical myocardium (a,b) as well as myocardial calcification. The lucency identified by red lines in b, is thought to be a fatty deposition in infarcted myocardial tissue, and the calcification represents dystrophic calcification in the necrotic tissue. Note that the calcification is not in the pericardium which is identified by the red markers in c. The pericardium is surrounded by pericardial at on the outside and epicardial fat on the inside. Included in the differential diagnosis is an apical aneurysm with calcification in clot. The calcification in the annulus is premature and unusual for this 56 year old male patient. Note the small bilateral pleural effusions. Courtesy Ashley Davidoff MD. 29601c01 code CVS cardiac heart MAC apical fat MI calcium myocardium apex cardiac imaging radiology CTscan radiologists and detectives |
References and Links
TCV





 LV Hypertrophy

 LVE on CXR